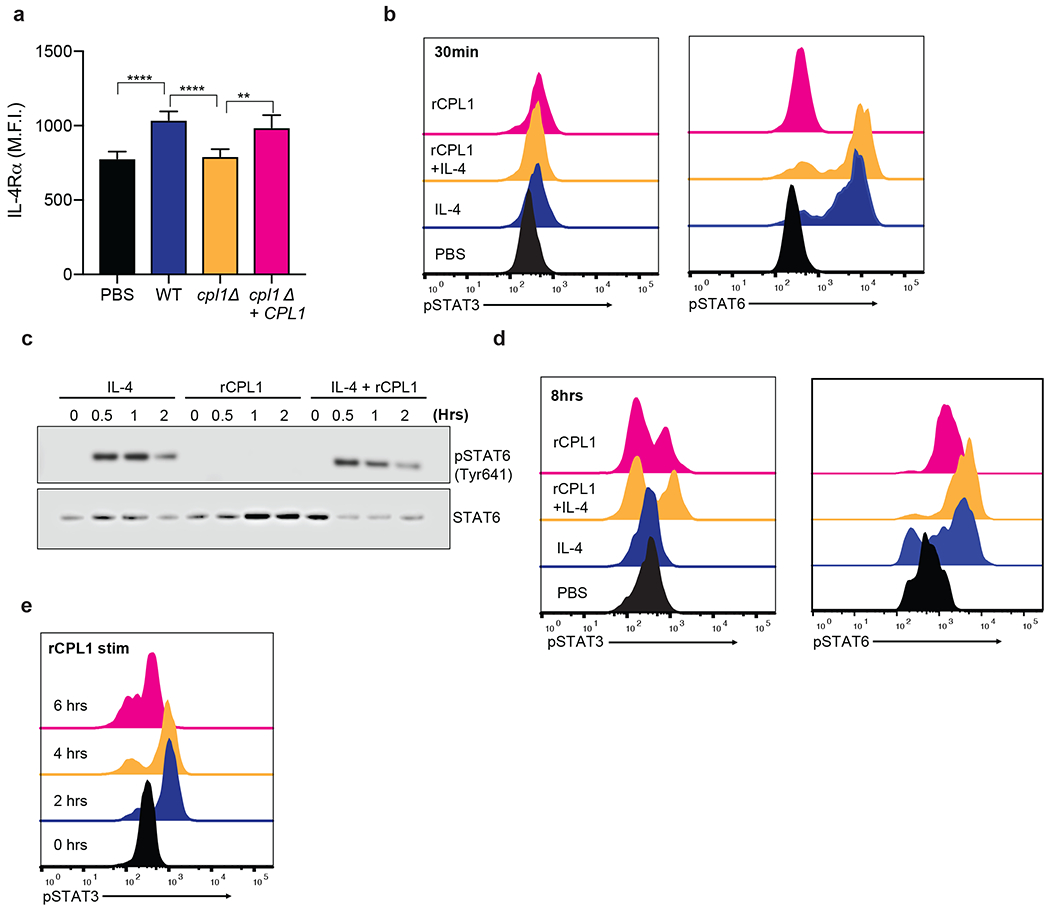
Exended Data Figure 4.

(a) Representative FACS staining of surface IL-4Rα levels on BMDMs stimulated for 24hrs with the indicated C. neoformans strains (MOI=10). n = six biologically independent samples (b) Phospho-FACS for pSTAT3 (left) and pSTAT6(right) after 30min of stimulation with PBS, IL-4 (10ng/ml), rCPL1 (111nM), or IL-4 + rCPL1. (c) Western blot for pSTAT6 or total STAT6 on BMDMs stimulated for the indicated times with either IL-4 (10ng/ml) alone, rCPL1 (111nM) alone, or IL-4 + rCPL1. Data are representative of three independent experiments. (d) Phospho-FACS for pSTAT3 (left) or pSTAT6 (right) in BMDMs after 8hrs of stimulation with PBS, IL-4 (10ng/ml), rCPL1 (37nM), or rCPL1+IL-4. (e) Phospho-FACS for pSTAT3 in BMDMs stimulated with 111nM rCPL1 for the indicated time points. Data are presented as mean values +/− SD.
