Figure 4.
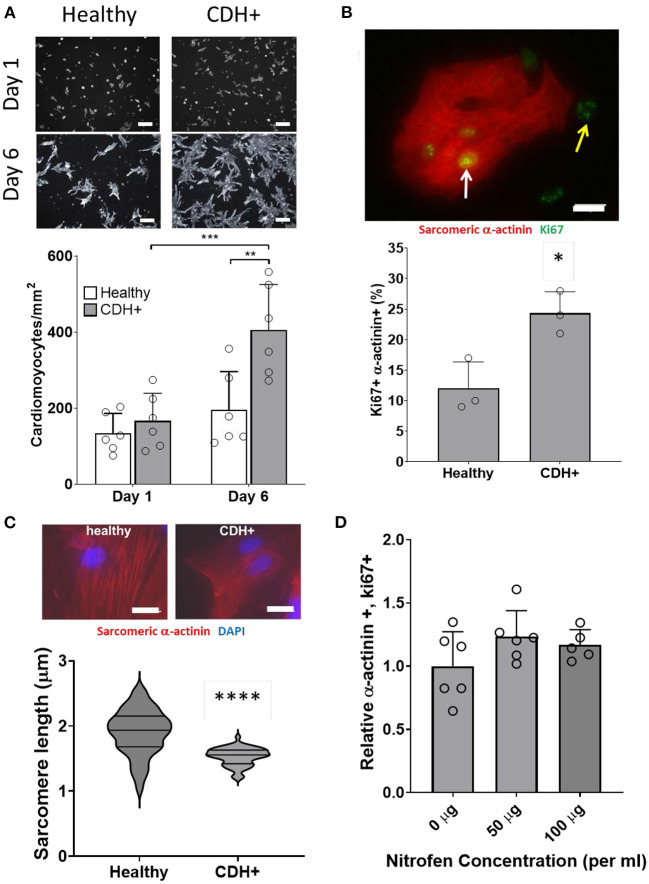
Characterization of CDH+ cardiomyocytes in culture. (A) Representative images of cardiomyocytes (α-actinin stain in gray scale) after 1 day or 6 days in culture (top). Cardiomyocyte density at 1 and 6 days (bottom). Graph shows mean ± SD (n = 6). ** Denotes p < 0.01 w.r.t. Healthy cells at Day 6. *** Denotes p < 0.001 w.r.t. CDH+ at 24 h. (B) Cardiomyocyte proliferation (Ki67+ α-actinin+) at 2 days. Inset shows example of Ki67+ cardiomyocyte (white arrow) and non-myocyte (yellow arrow). Graph shows mean ± SD (n = 3). * Denotes p < 0.05. (C) Representative images of sarcomere staining in healthy and CDH+ cardiomyocytes where Red is cardiac α-actinin and blue is the nuclear marker DAPI (top). Sarcomere length measurements (bottom). **** Denotes p < 0.001. (D) Proliferative cardiomyocytes at 72 h post-treatment with exogenous nitrofen. Data is normalized by relative expression of α-actinin+ and Ki67+ at 24 h pre-treatment. Graph shows mean ± SD (n = 5).

