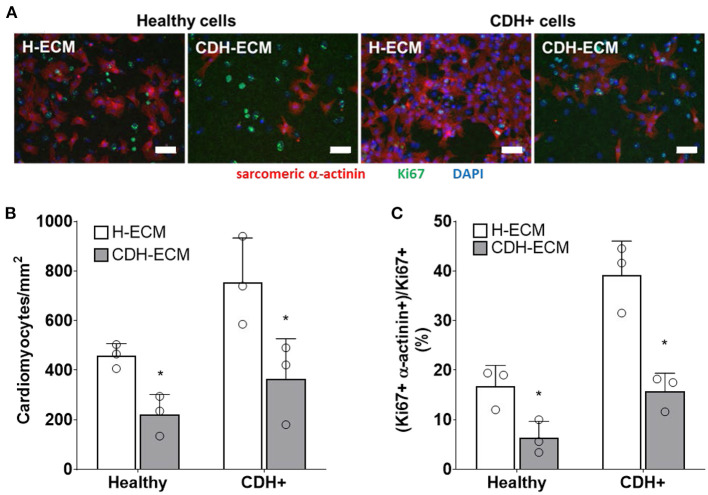
Figure 5.
Cardiomyocyte response to ECM. (A) Representative images of cells on ECM derived from healthy hearts (H-ECM) and CDH+ hearts (CDH-ECM), stained for Hoechst (blue), Ki67 (green), and cardiac α-actinin (red). (B) Cardiomyocyte density and (C) cardiomyocyte proliferation were significantly decreased in both healthy and CDH+ populations on CDH-ECM after 4 days in culture. Graphs show mean ± SD (n = 3). In all cases * denotes p < 0.05.

