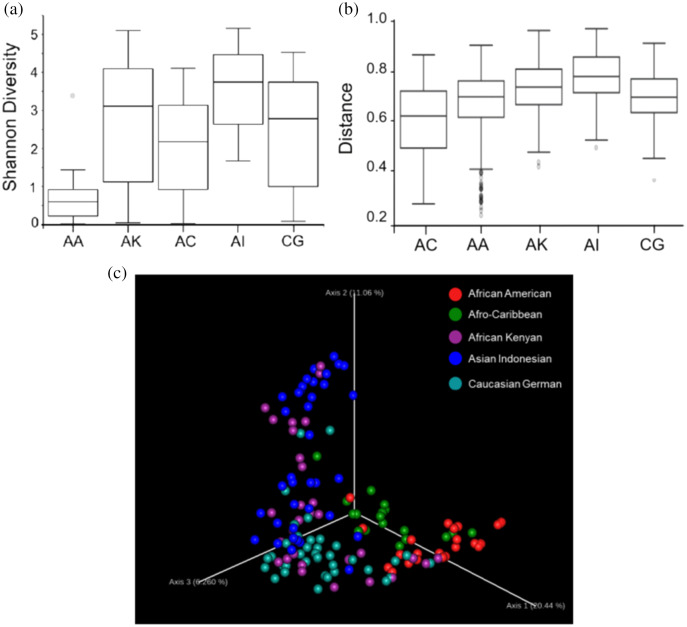
Figure 2. Plots showing species richness and diversity among the five ethnic groups (AA, African American; AC, Afro-Caribbean; AI, Asian Indonesian; AK, African Kenyan and CG, Caucasian German).
(A) Boxplot shows distribution of species richness and evenness within the vaginal microbiomes of the ethnic groups using Shannon diversity matrix. (B) Boxplot showing the distribution of unweighted unifrac distances among the five ethnicities. (C) Three-dimensional principal coordinates analysis (3D-PCoA) visualization of pairwise Bray-Curtis distance matrices indicating vaginal bacterial species diversity among the five ethnicities.

