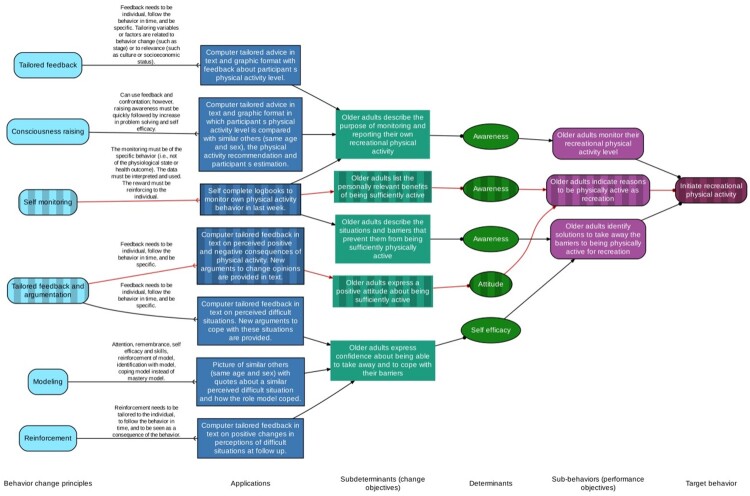
Figure 1.
ABCD for (parts of) the intervention Active plus (Van Stralen et al., 2008). The dashed boxes and red lines represent the pathways that were discussed in the text. Note. Each box represents one of the seven columns in the ABCD matrix. The lines with the fork-shaped ends in between behavior change principles and application stand for ‘implemented in’. Applications are manifest constructs and have, in the tradition of drawing pathways in structural equation modeling (SEM; Stein et al., 2012), been placed in rectangles. In turn, the determinants have been placed in ovals as they are latent constructs (again in the tradition of SEM). The lines with three types of arrowheads represent three relationship types: regular arrowheads represent causal relationships, points represent structural relationships, and forks represent that applications implement a BCP. The shape of the boxes for sub-determinants has been chosen to distinguish them from the rest, as they are less likely to be conceptualized as a latent construct on their own, instead being closer to what in SEM is called an indicator.

