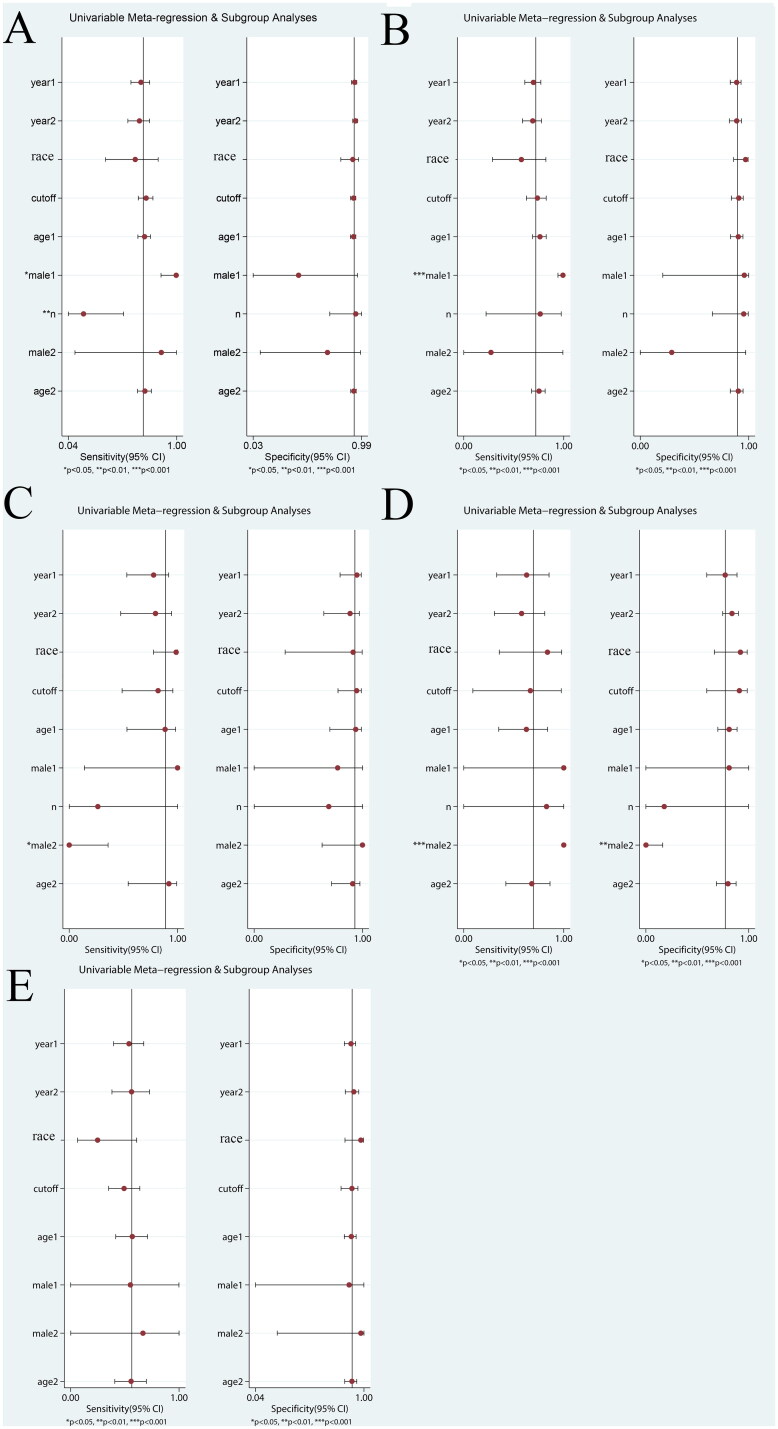
Figure 8.
The univariable meta-regression and subgroup analysis of other biomarkers (A, DCP; B, GPC3; C, GP73; D, DKK1; E, AFP-L3) (year1, research time; year2, publication time; age1, average age of HCC group; male1, male proportion of HCC group; n, proportion of early HCC; male2, male proportion of control group; age2, average age of control group).

