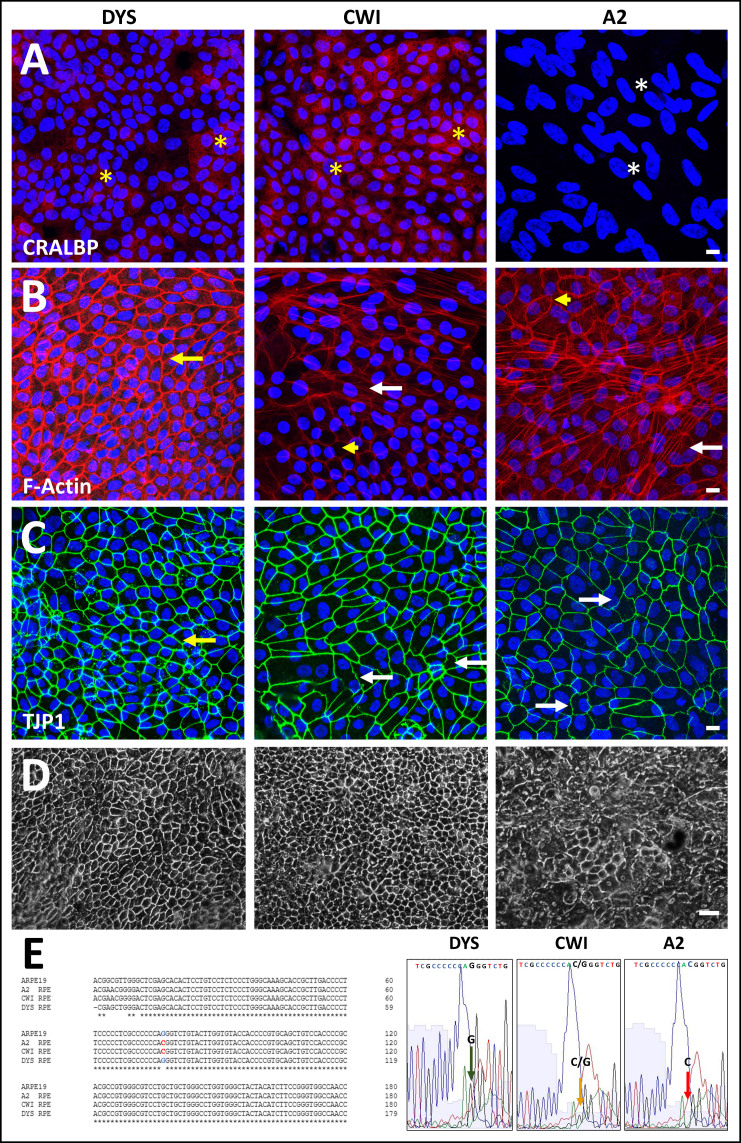
Figure 1.
Comparison of control (DYS) and SLOS-derived (CWI, A2) iPSC-RPE cell morphology and genotype. Comparison of CRALBP and ZO1/TJP1 expression and F-actin organization in control (DYS) and SLOS-derived (CWI, A2) iPSC-RPE cells. Immunohistochemical (IHC) analysis of (A) CRALBP, (B) phalloidin cytochemical staining of F-actin, and (C) TJP1, and in DYS, CWI, and A2 RPE cells. DYS RPE cells formed a continuous monolayer consisting of polygonal cells with well-defined TJP1-positive cell borders and variable cytoplasmic CRALBP expression levels (yellow asterisks, A). CWI cells exhibited some irregularity in their cell borders and, like DYS cells, variable cytoplasmic CRALBP expression (yellow asterisks, A), while A2 RPE cells had low to absent CRALBP expression (white asterisks, A). DYS RPE cells exhibited predominantly lateral, cortical F-actin (yellow arrow, B). Increased F-actin stress fiber formation was evident in both SLOS-derived RPE cell lines, especially in A2 RPE cells (white arrows, B), however, both SLOS RPE also exhibited normal lateral, cortical F-actin labeling (yellow arrowheads, B). TJP1-positive cell borders appeared uniform in DYS RPE cells (yellow arrow, C), but irregular in some CWI RPE cells (white arrows, C). A2 RPE cells exhibited heterogeneity, with areas of regular cell border contacts, and areas of highly irregular and undulating TJP1 immunolabeling (white arrows, C). Scale bar (panels A-C): 10 µm. D: Lower-magnification phase contrast images of DYS, CWI, and A2 RPE cell cultures grown on poly-L-ornithine coated dishes for transcriptomic and protein expression analyses. Scale bar: 50 μm. E: Genotype and Sanger sequence verification of IVS8G-C mutation site confirming its heterozygous (CWI, yellow arrow, small G peak and merged C peak) and homozygous (A2, red arrow, G peak absent, merged C peak) state in SLOS-derived RPE cells, respectively. DYS RPE cells and ARPE-19 cells served as negative biological controls.

