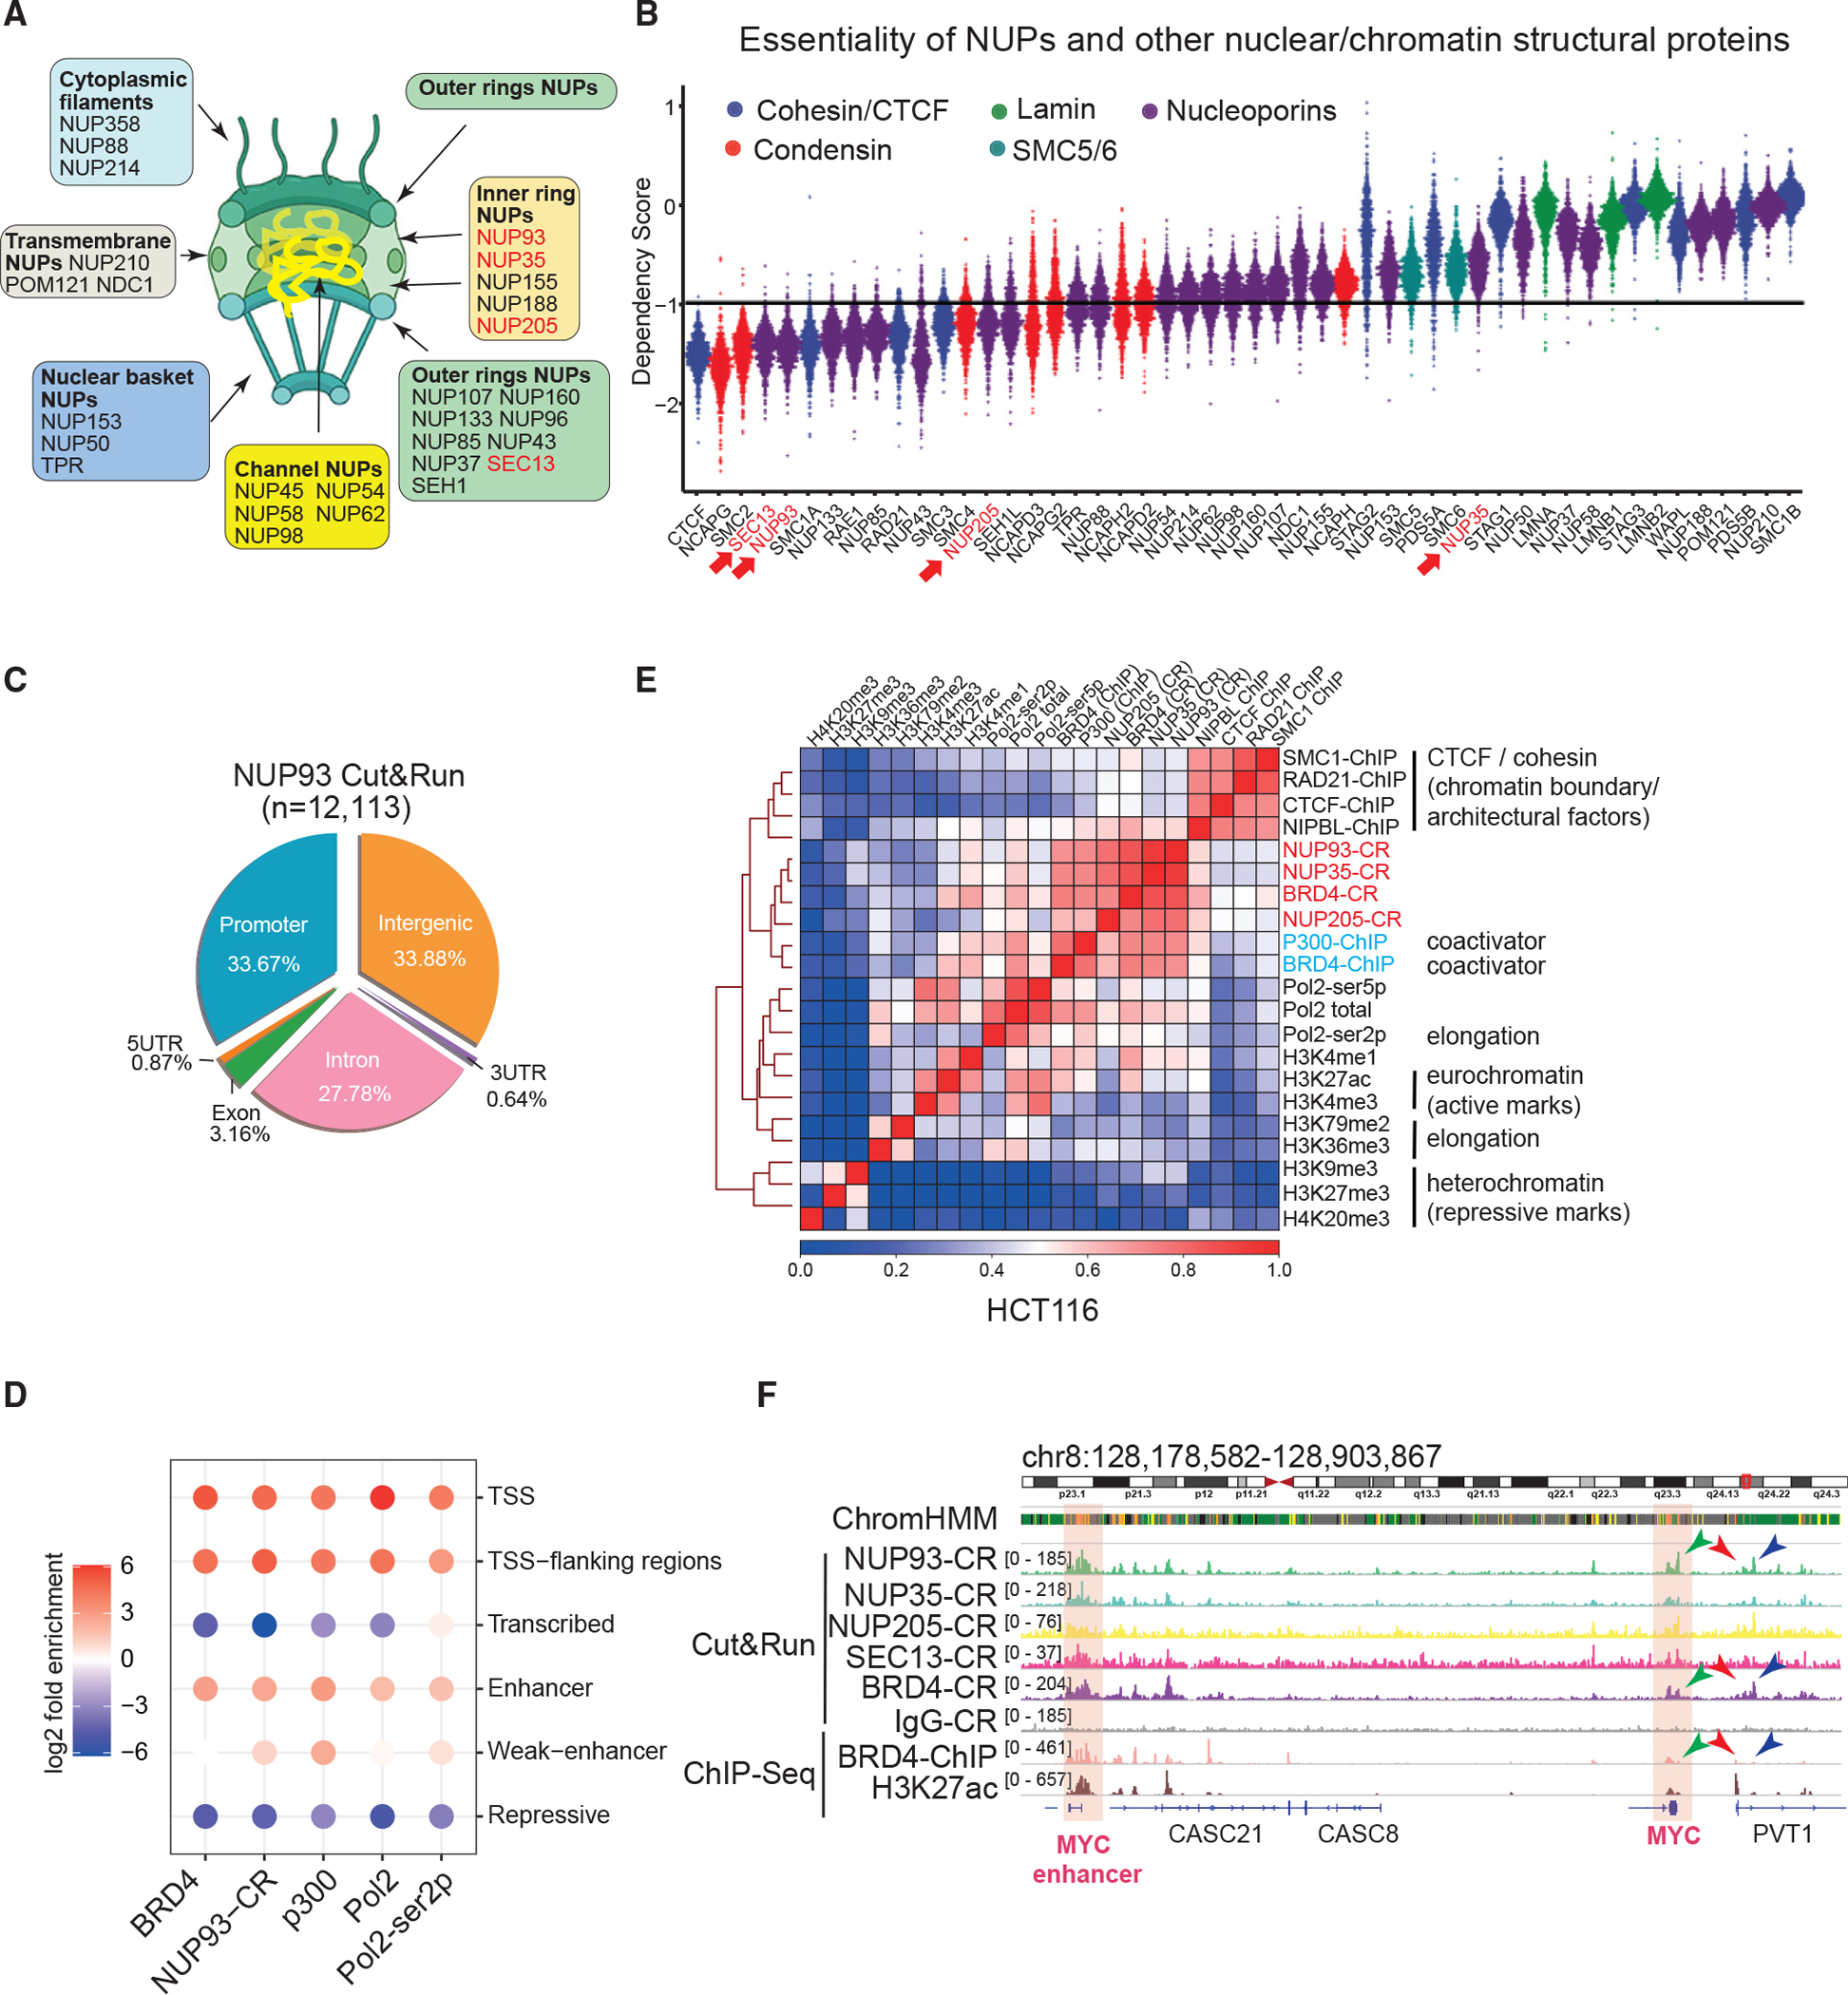
Figure 1. Core NUPs bind active promoters and enhancers in human cells.

(A) A diagram of the NPC, its subcomplexes, and NUPs.
(B) Dependency score plot for factors. The value of – 1 represents the cutoff to deduce essential genes. Each dot denotes one of the 789 cell lines. NUPs we made using Cut&Run data are marked in red.
(C) The Cut&Run peak distribution of NUP93 in HCT116 cells.
(D) Folds of enrichment of factors in distinctive chromatin states were determined by using observed versus background. 18 states defined by histone marks in Figure S1D were merged into 6 major states. CR, Cut&Run.
(E) Heatmap of pairwise Pearson correlations between ChIP-seq or CR signals for various factors in HCT116 cells. The color scale indicates Pearson correlation coefficients.
(F) Genome browser snapshot of CR and ChIP-seq of core NUPs and BRD4 at the CCAT1-MYC locus. Highlighted areas indicate CCAT1 (i.e., the MYC enhancer) and MYC gene.
