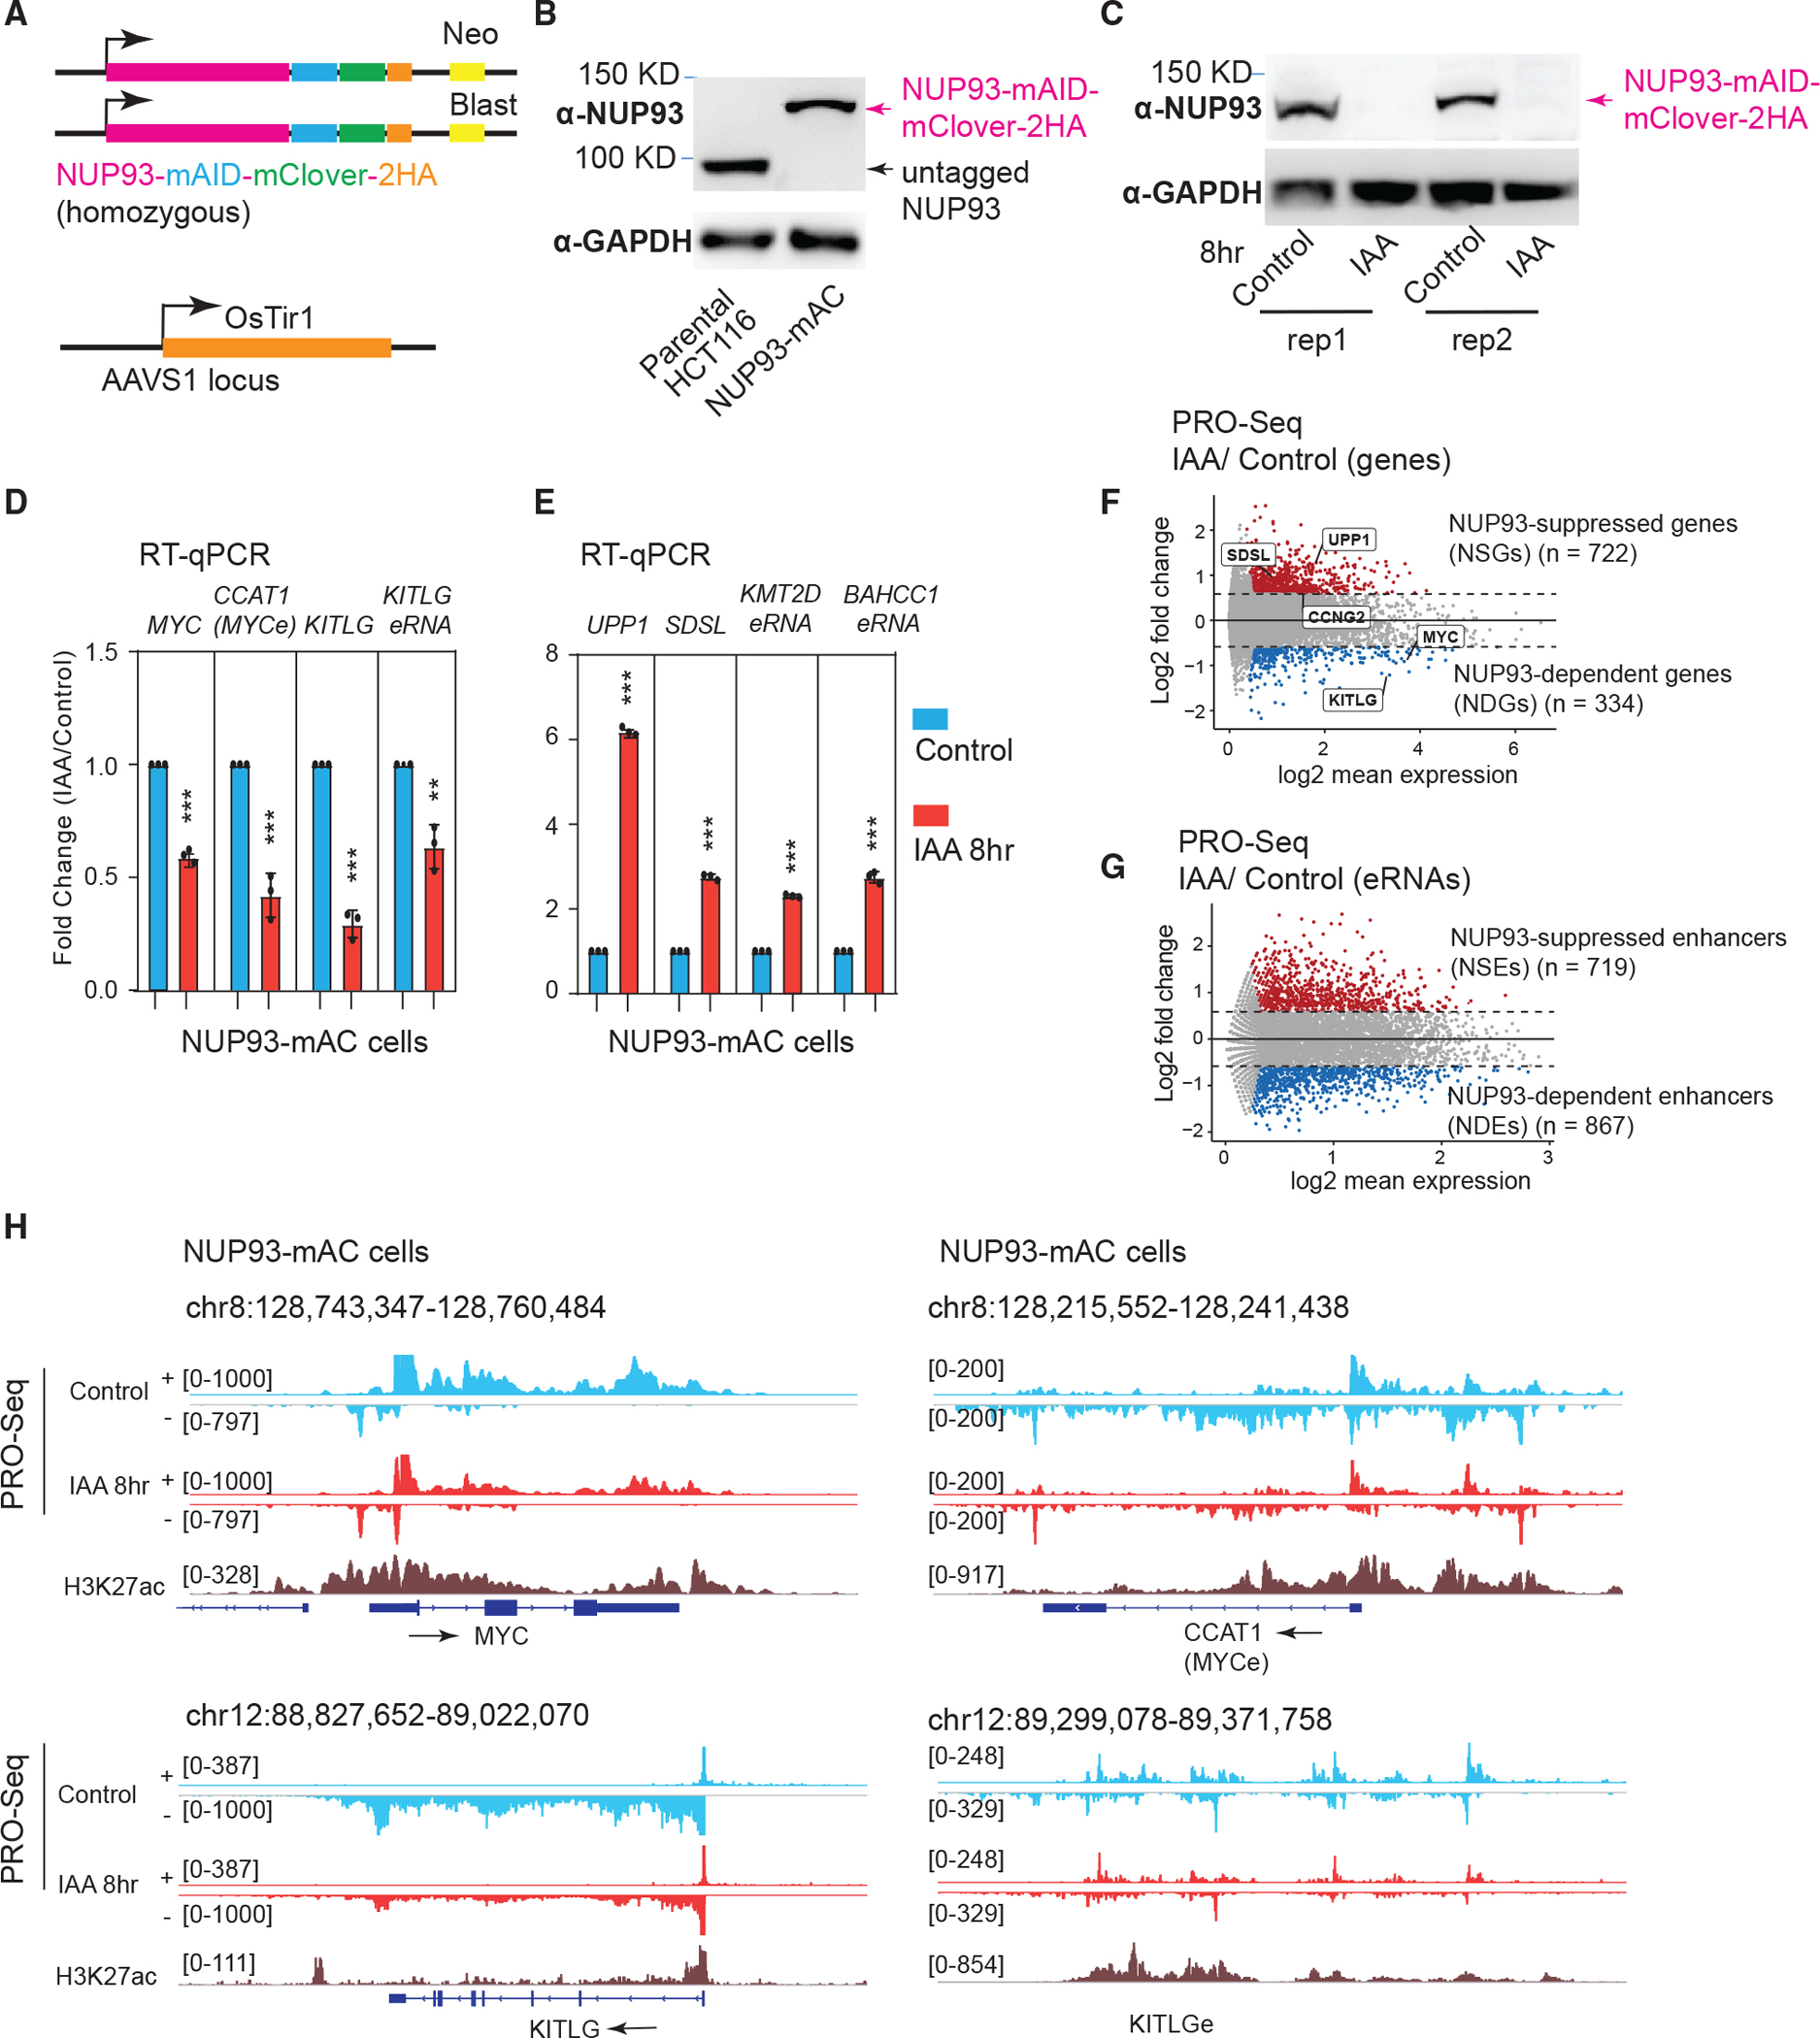
Figure 2. Acute NUP degradation in human cells deregulates gene and enhancer transcription.

(A) Top: knockin design for generating degron cell lines. Bottom: OsTir1 was inserted into parental HCT116 cells at the AAVS1 locus.
(B) Western blot analysis of NUP93 in parental cells or in degron cells expressing NUP93 tagged by mAID, mClover, and 2HA (NUP93-mAC).
(C) Western blot analysis after 8 h of auxin treatment of NUP93-mAC cells (two sets of samples are shown). IAA, indole-3-acetic acid.
(D and E) qRT-PCR analysis of genes and eRNAs changed by 8 h of IAA treatment to degrade NUP93. The bars represent mean ± SD (n = 3 technical replicates). Each plot is a representative example from more than 3 biological replicates. Student’s t test; **p < 0.01, ***p < 0.001.
(F and G) MA plots depicting differential transcriptional activities (PRO-seq) for genes and enhancers upon acute NUP93 depletion (IAA, 8 h) versus vehicle conditions (control). Upregulated genes and enhancers are highlighted in red and down-regulated ones in blue. The x axis shows log2 transformed RPKM values, and the y axis represents the log2 FC (IAA/control).
(H) PRO-seq tracks for control and acute NUP93 depletion (IAA, 8 h) conditions over representative genomic regions: MYC, CCAT1 (MYC enhancer), and KITLG and KITLG enhancer (KITLGe). + and − indicate Watson and Crick strands, respectively; arrows indicate the transcriptional direction of genes/eRNAs.
