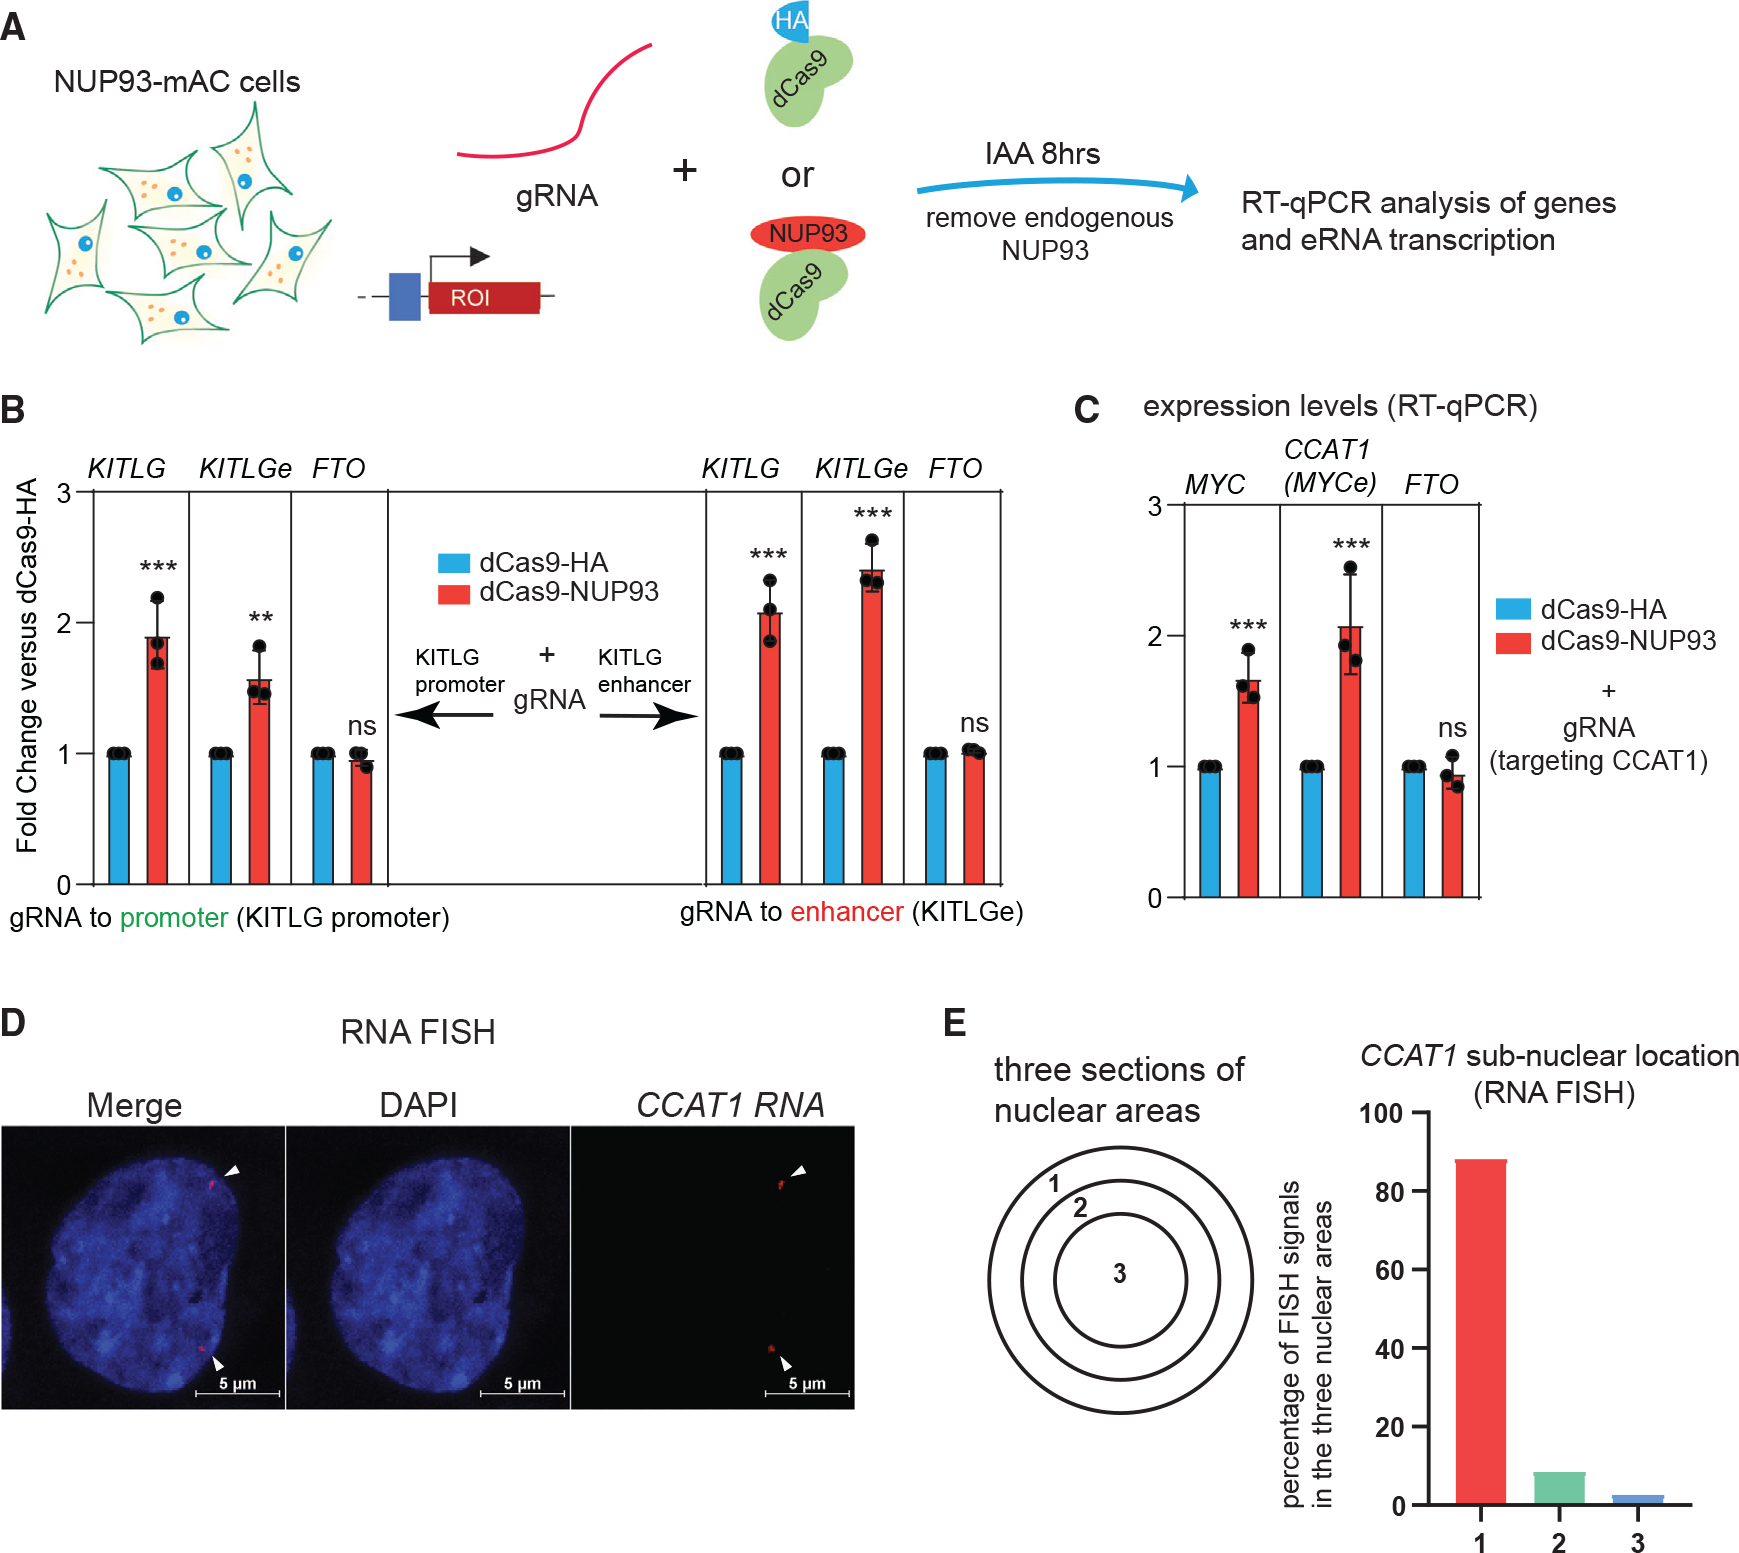
Figure 3. NUP93 acts as a direct transcriptional activator in the nuclear periphery.

(A) A diagram of the CRISPR-dCas9-based NUP93 tethering strategy in cells with endogenous NUP93-mAC depleted.
(B) qRT-PCR analysis of the target gene and eRNA expression upon CRISPR-dCas9 tethering of NUP93 to the KITLG promoter or enhancer (with endogenous NUP93 depleted).
(C) qRT-PCR analysis of the target MYC gene and eRNA expression upon CRISPR tethering of NUP93 (with endogenous NUP93 depleted).
(B and C) The bars represent mean ± SD (n = 3 technical replicates). Each plot is a representative example from 3 biological replicates. Student’s t test; *p < 0.05, ***p < 0.001; ns, not significant.
(D) Representative RNA FISH images of CCAT1 in HCT116 cells. White arrowheads point to the positions of RNA FISH signals. Scale bar, 5 μm.
(E) A diagram of subnuclear areas defines the nuclear periphery versus nuclear center. Right panel: quantified percentage of CCAT1 FISH signals in each subnuclear area (n > 200 FISH foci counted).
