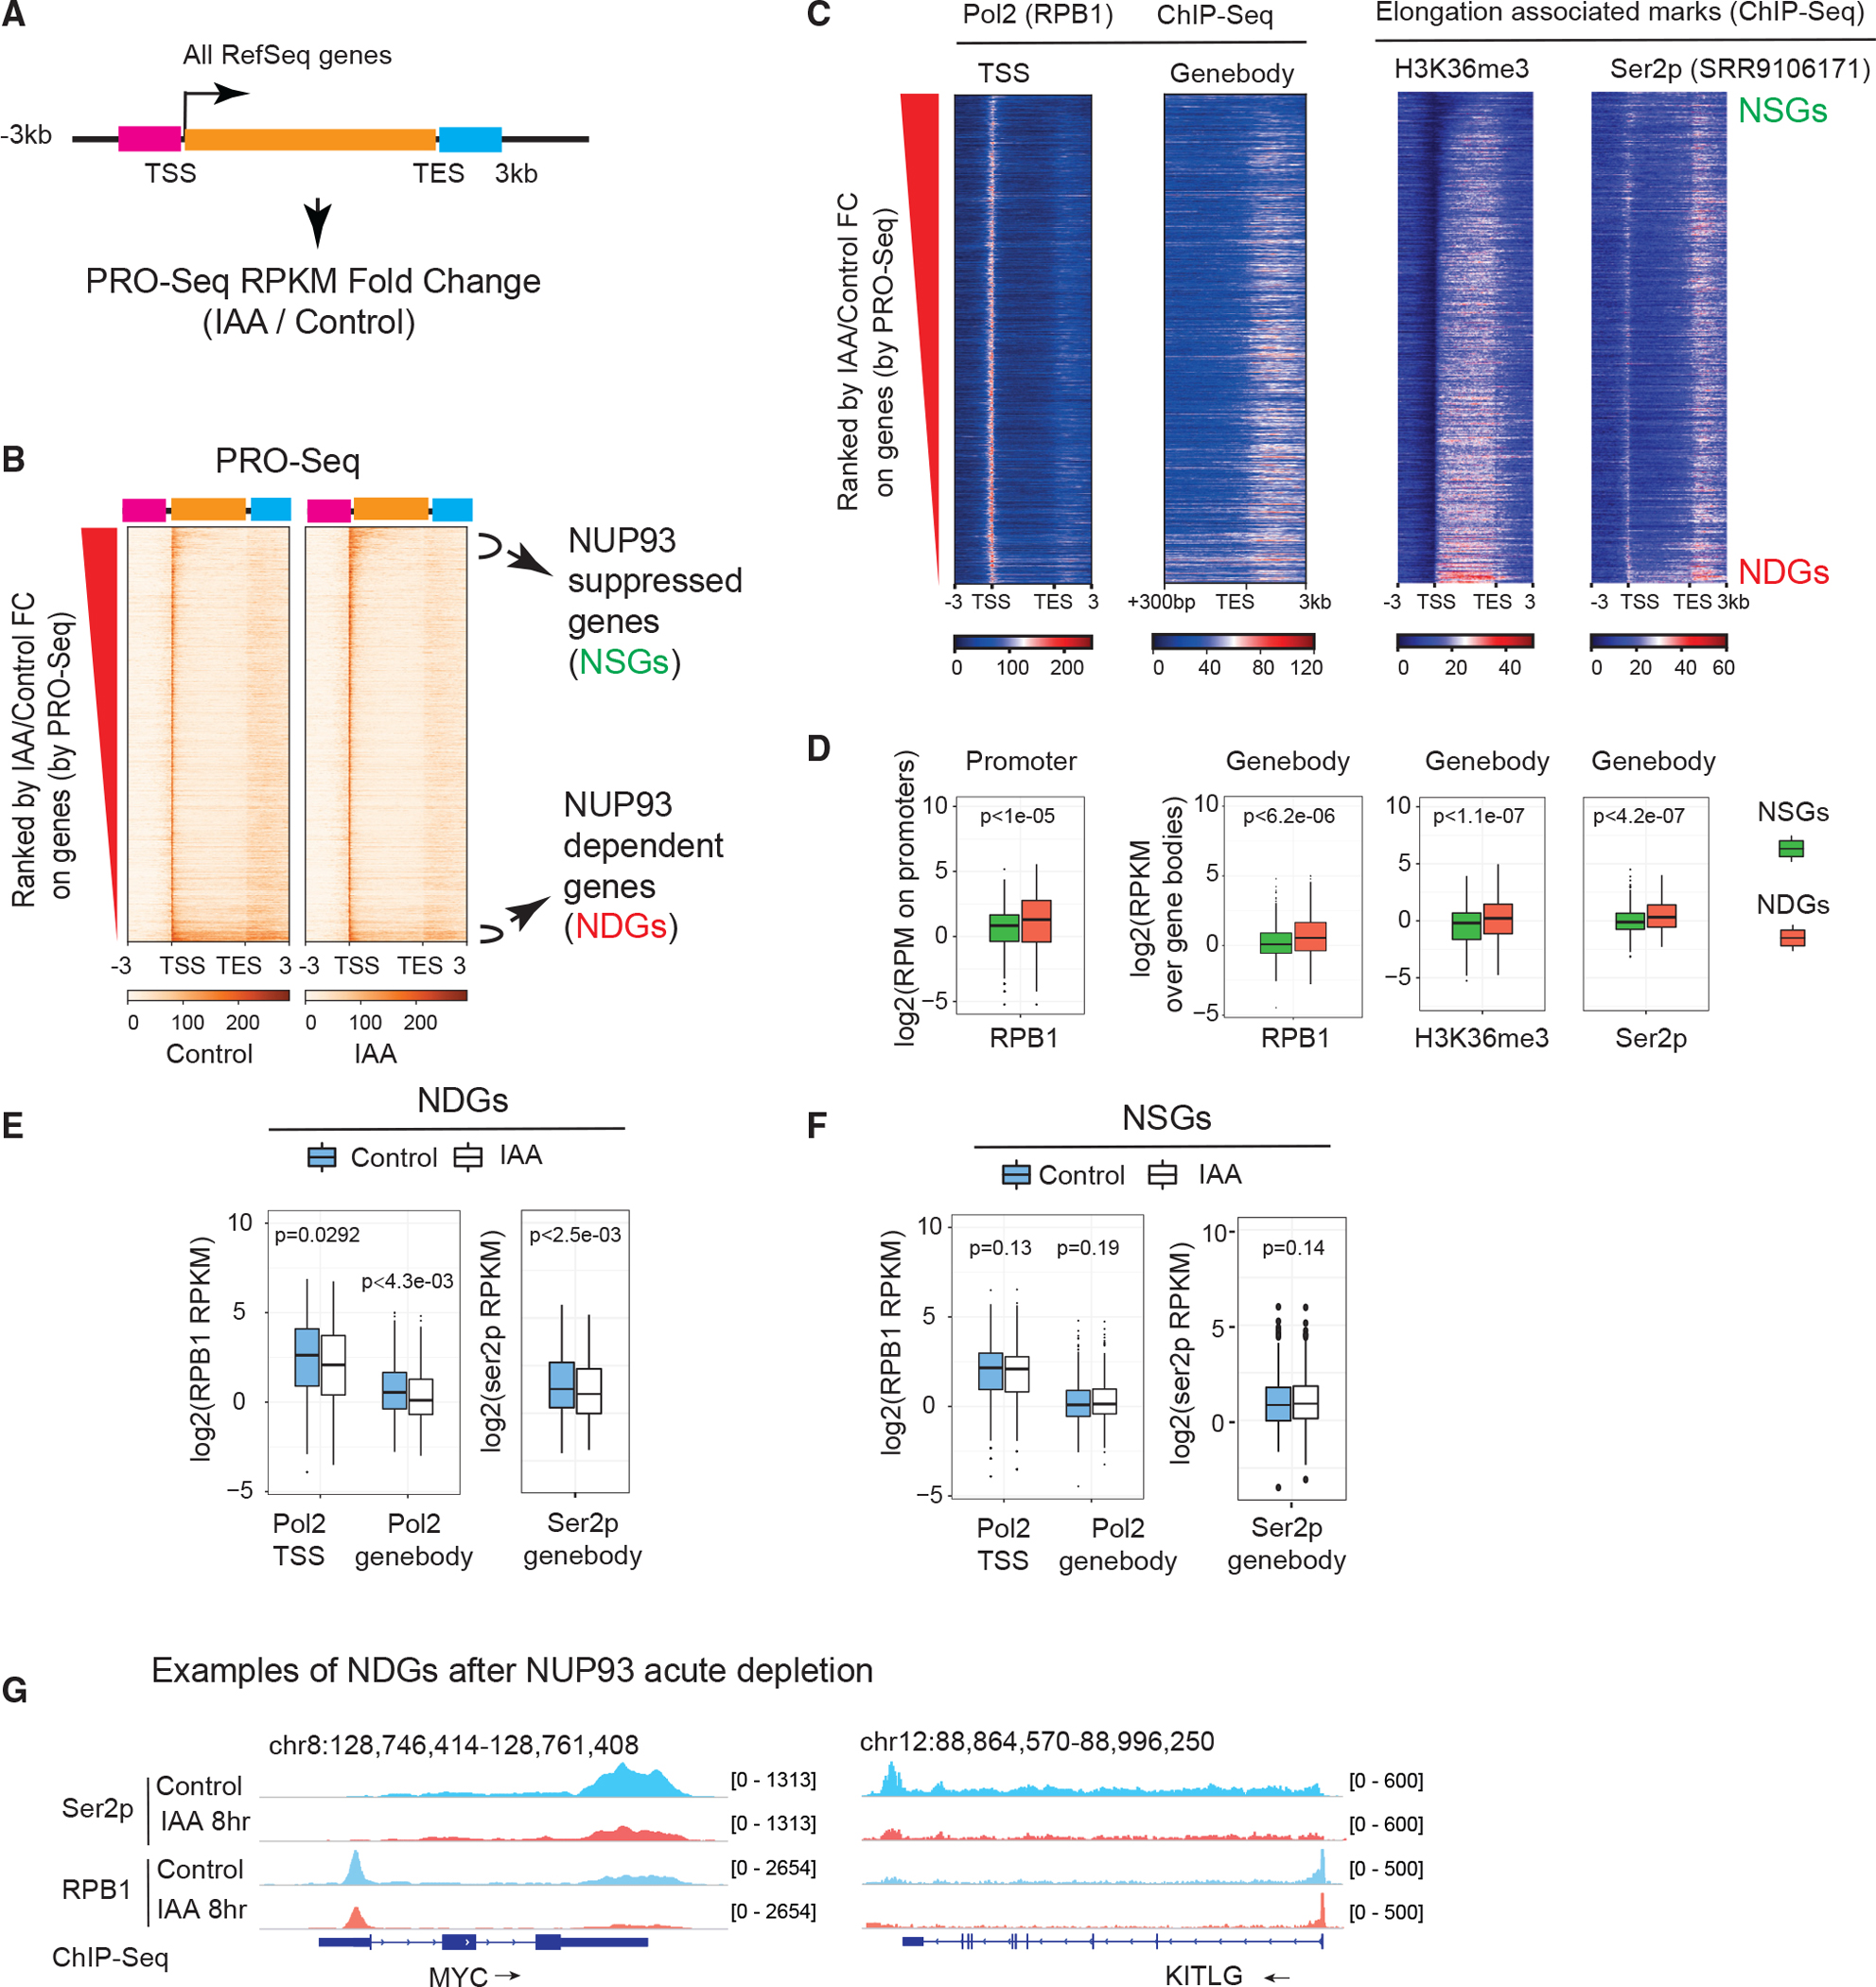
Figure 4. NUP93 is required for RNA Pol II loading and transcriptional elongation of NDGs.

(A) A diagram showing how we ranked transcribed genes by changes in control (vehicle, 8 h) versus NUP93 depletion (IAA, 8 h). Orange bar, gene body; pink bar, 3 kb upstream of transcriptional start sites (TSSs); light blue bar, 3 kb downstream of transcriptional end sites (TESs).
(B) Heatmap displaying all transcribed genes ranked by PRO-seq FC (IAA/control).
(C) Heatmaps of normalized ChIP-seq of total RNA Pol II, the elongation histone mark (H3K36me3), and Ser2p in the same order as in (B).
(D) Boxplots comparing features of NSGs and NDGs over their promoters (TSS ± 300 bp) or gene bodies (+300 bp from the TSS to the gene ends). For Ser2p, we extended gene bodies to 3 kb after TESs. p values: Wilcoxon rank-sum test.
(E and F) Boxplots showing the intensity of RNA Pol II or Ser2p before and after IAA treatment over the TSS regions or gene bodies of NDGs and NSGs.
(D–F) For boxplots, center lines represent medians, box limits indicate the 25th and 75th percentiles, and whiskers extend 1.5 times the interquartile range (IQR) from the 25th and 75th percentiles. p values: Wilcoxon rank-sum test.
(G) Genome browser snapshots over the MYC and KITLG genes; arrows show gene transcription direction.
