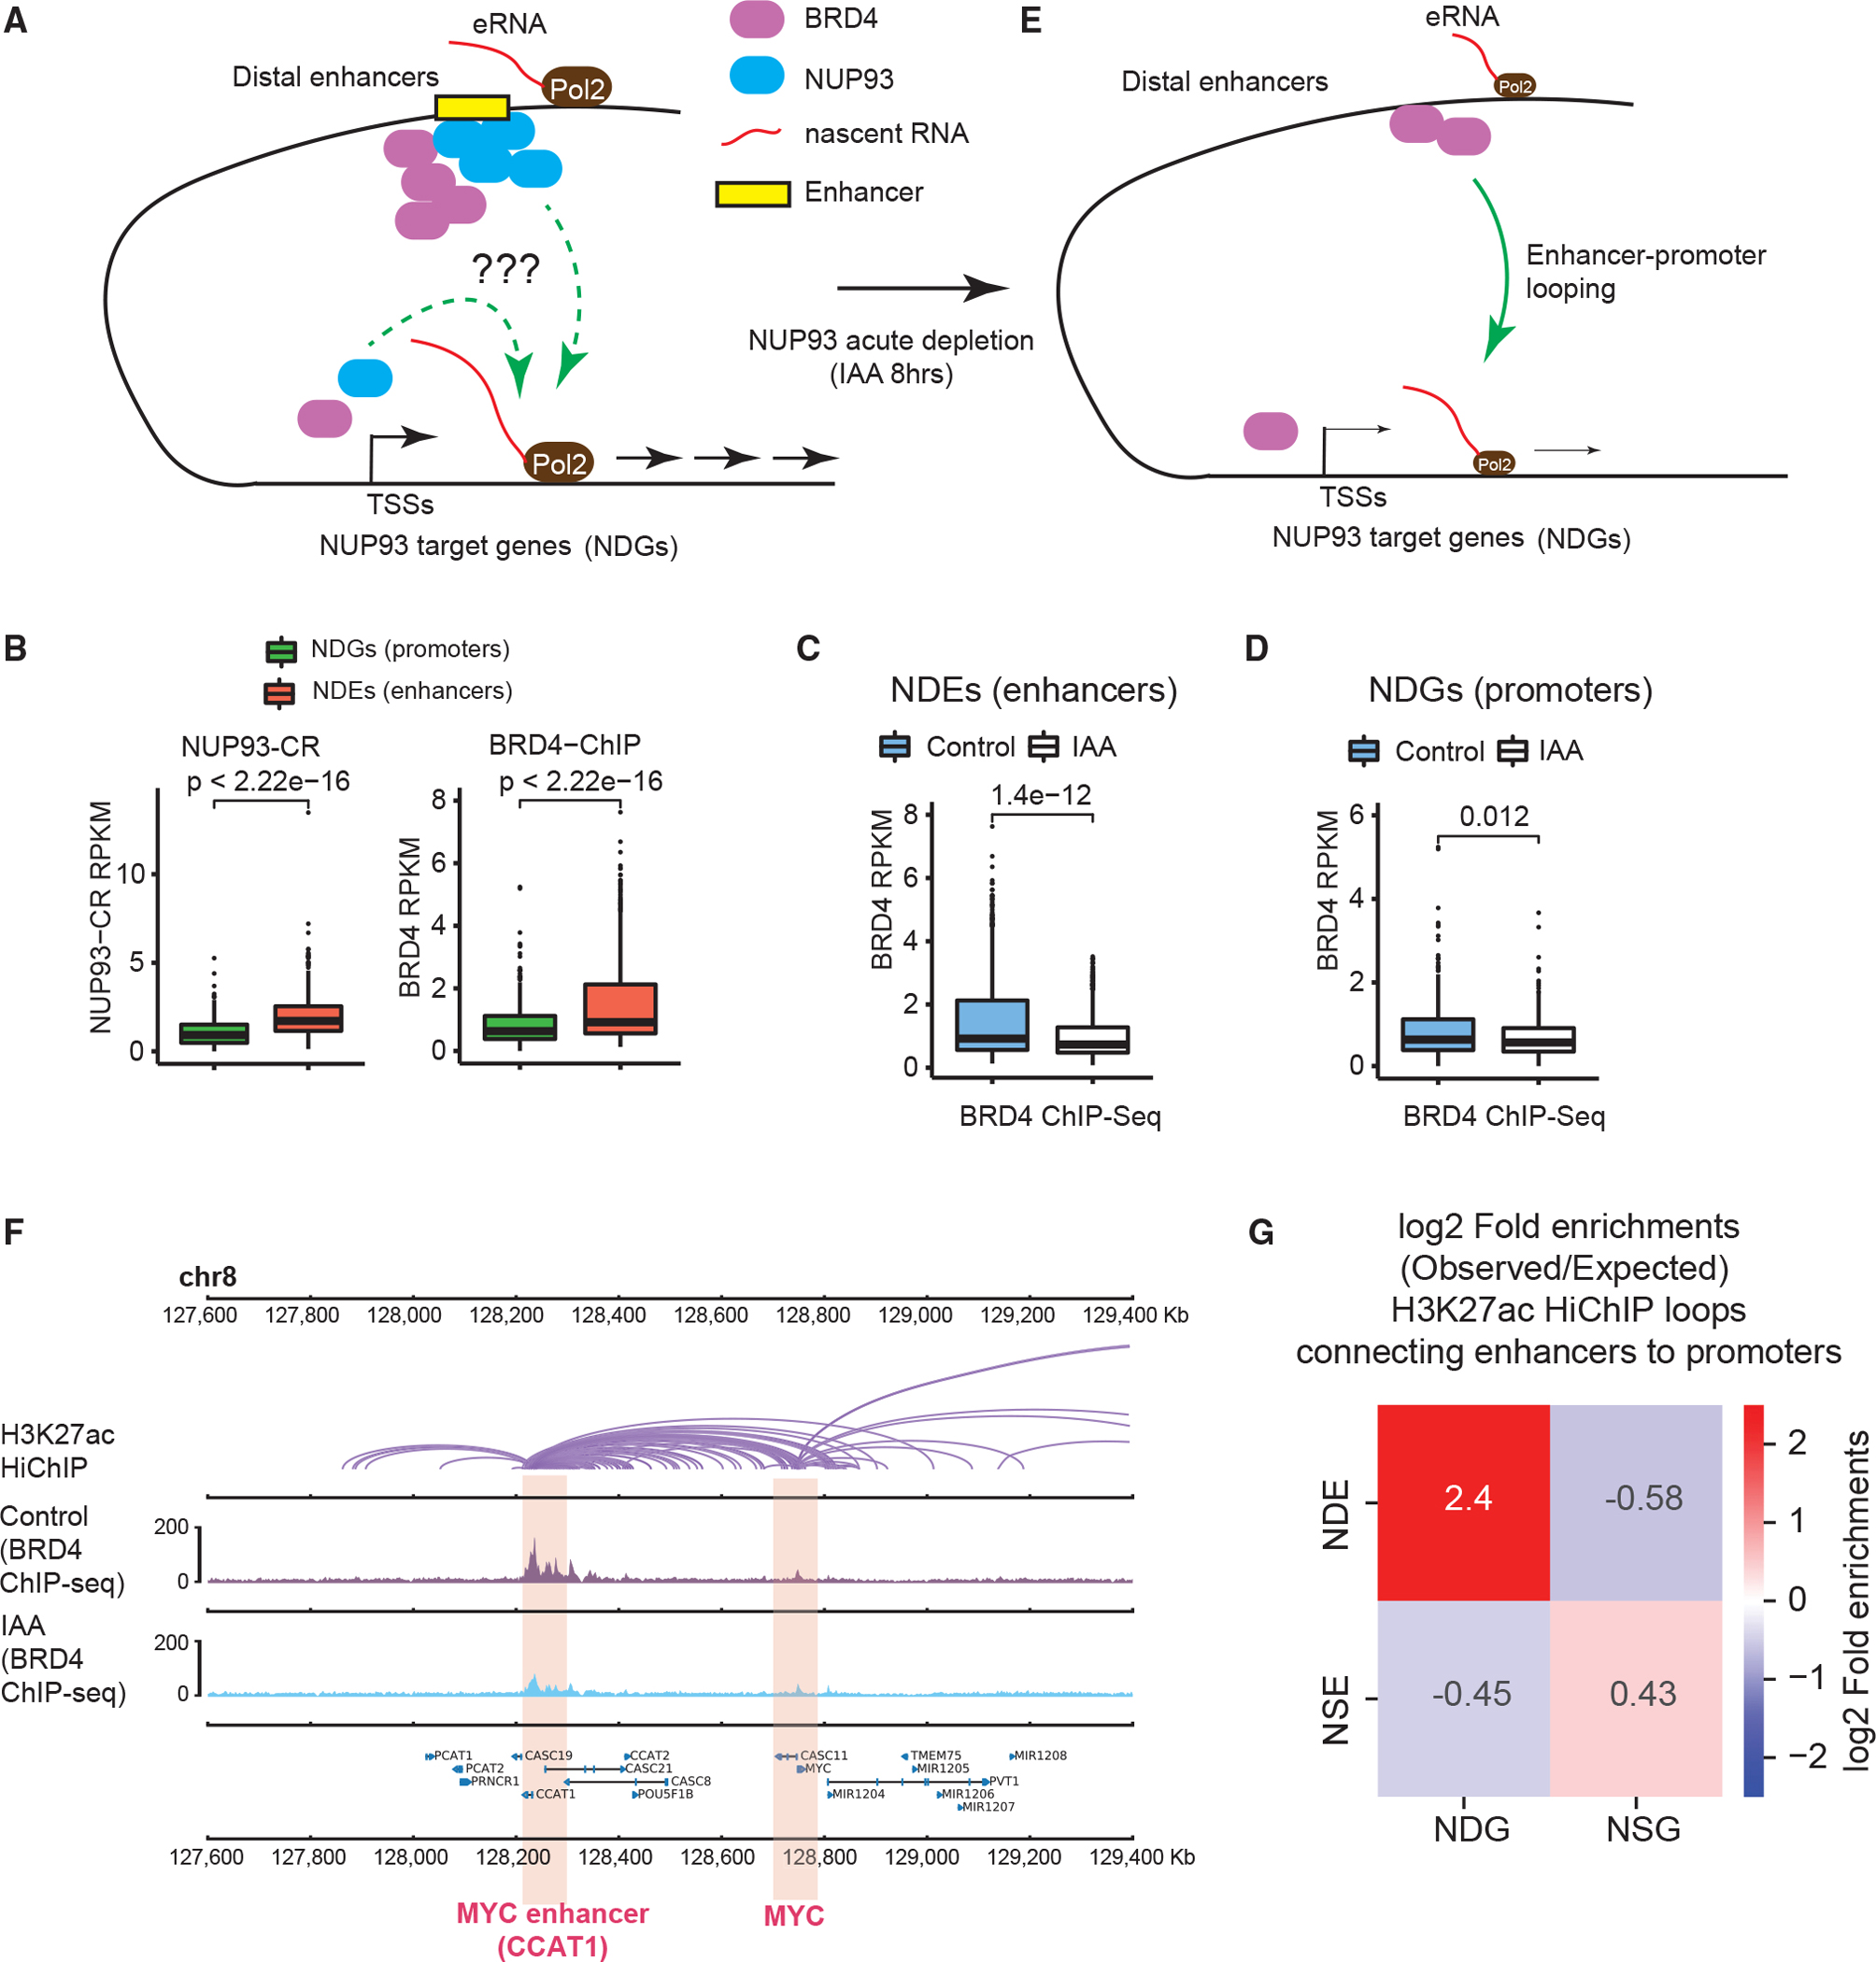
Figure 5. NUP93 promotes BRD4 recruitment to active enhancers to activate gene transcription.

(A) A diagram showing the questions to examine: how does NUP93 regulate RNA Pol II loading and/or target gene elongation, and what is its relationship with BRD4 binding?
(B) Boxplots showing the levels of NUP93 or BRD4 at NDEs or NDG promoters.
(C and D) Boxplots showing the changes of BRD4 ChIP-seq at NDEs or NDG promoters because of acute NUP93 depletion.
(B–D) For boxplots, center lines represent medians, box limits indicate the 25th and 75th percentiles, and whiskers extend 1.5 times the IQR from the 25th and 75th percentiles. p values: Wilcoxon rank-sum test.
(E) A diagram showing BRD4 binding changes after acute NUP93 depletion; the question was also raised whether NDEs act on NDGs via chromatin looping.
(F) A representative region encompassing MYC-CCAT1 showing H3K27ac HiChIP (in wild-type HCT116 cells), BRD4 ChIP-seq under control and IAA (acute NUP93 depletion) conditions; gene annotation is shown at the bottom. Each purple arc in HiChIP denotes a loop called by FitHiChIP.
(G) Heatmaps showing the folds of enrichment of observed enhancer-promoter loops formed between specific enhancer or promoter groups over the expected frequency using randomly shuffled enhancer and promoter lists (see Figure S5E and STAR Methods for additional information). Chromatin loops were defined by H3K27ac HiChIP using FitHiChIP.
