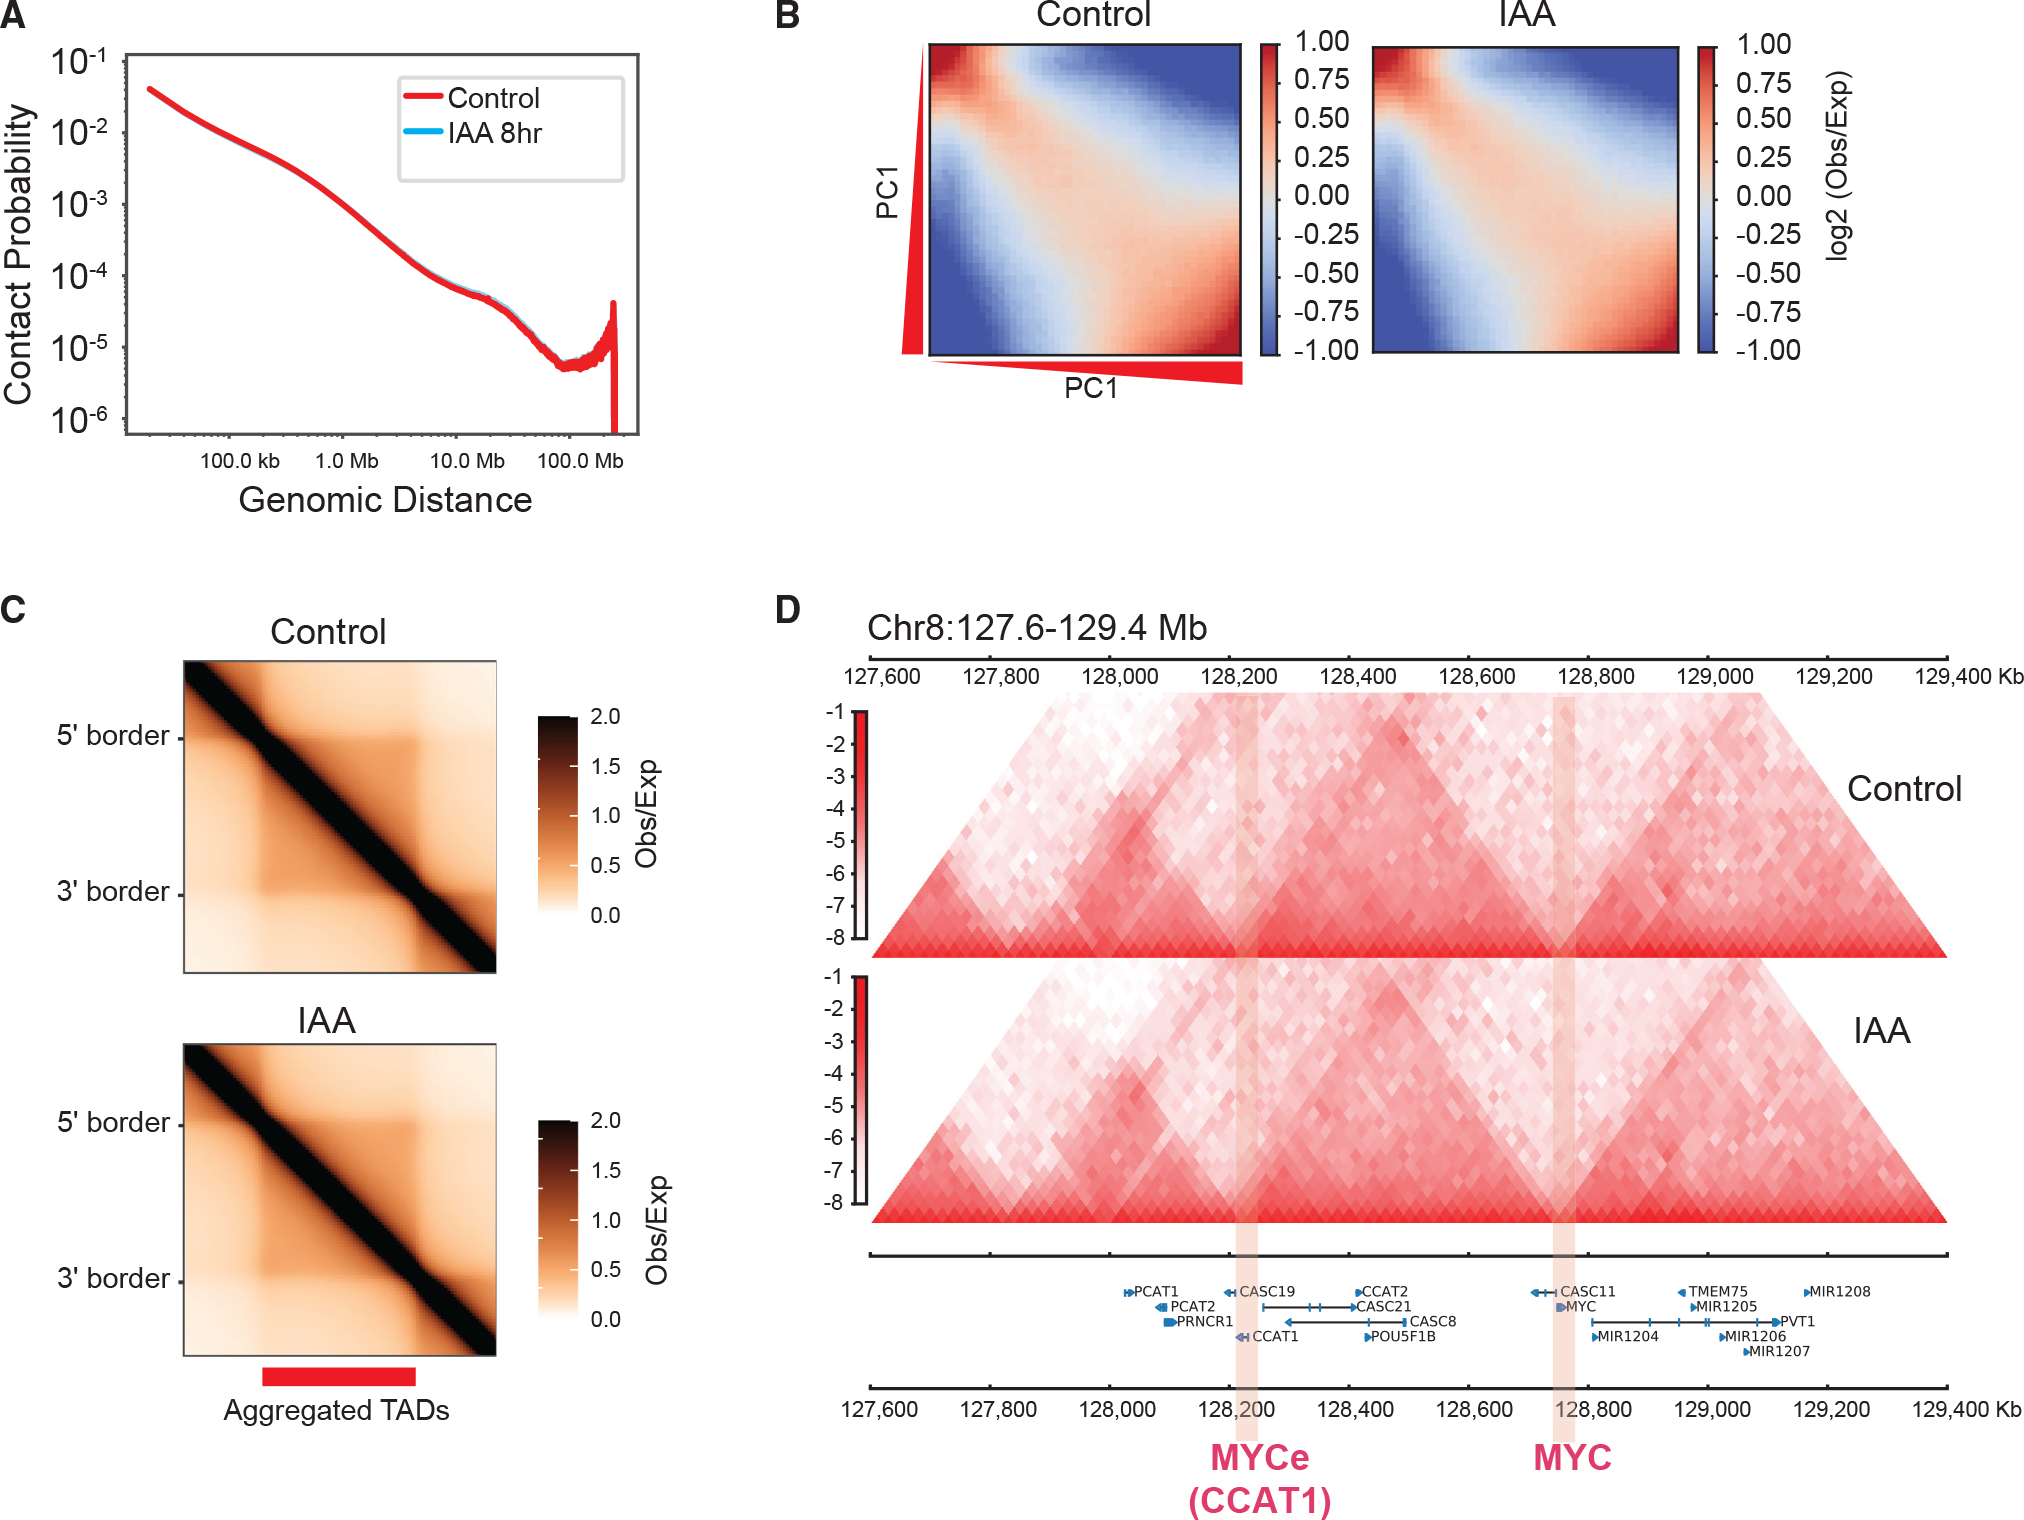
Figure 6. NUP93 is dispensable for the overall organization of higher-order genome architecture.

(A) A P(s) curve plot generated from Hi-C, showing the relationship between chromatin contact probability (P) and linear genomic distances (s) under control and 8-h IAA (acute NUP93 depletion) conditions.
(B) Saddle plots of chromatin compartmentalization, showing intrachromosomal interaction frequencies between 20-kb bins, normalized by the expected contact frequency. Bins are ranked by PCA E1 values under the control condition. The top left corner shows B-B interactions, and the bottom right corner shows A-A interactions. The scale indicates interaction strength (observed/expected) in Hi-C.
(C) Aggregated domain analysis (ADA) of all TADs under control (top) and 8-h IAA (bottom) conditions.
(D) An example region encompassing MYC and MYCe (CCAT1), showing Hi-C contact heatmaps under control and 8-h IAA conditions (at 20-kb resolution).
