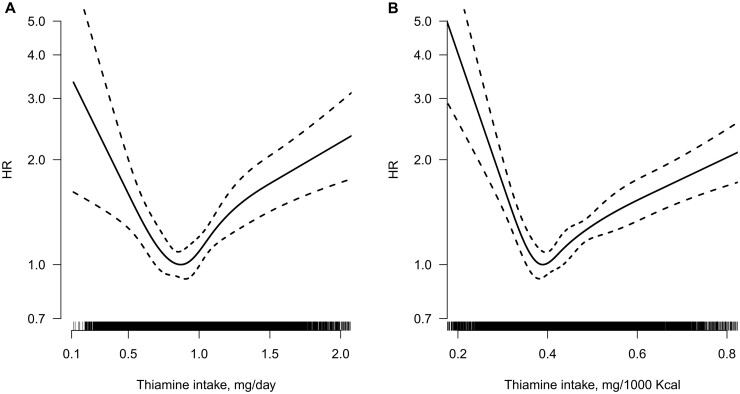
Figure 1.
Smoothing curve for the relationship between absolute thiamine intake expressed as mg/day (A) and thiamine intake expressed as mg/1000 kcal (B) with new-onset-diabetes.a aAdjusted for age, sex, survey year, body mass index, smoking, alcohol drinking, systolic blood pressure, diastolic blood pressure, antihypertensive drugs, education levels, urban or rural residents, regions, occupations, physical activity and dietary intakes of sodium, potassium, fibre, carbohydrate, protein and fat.

