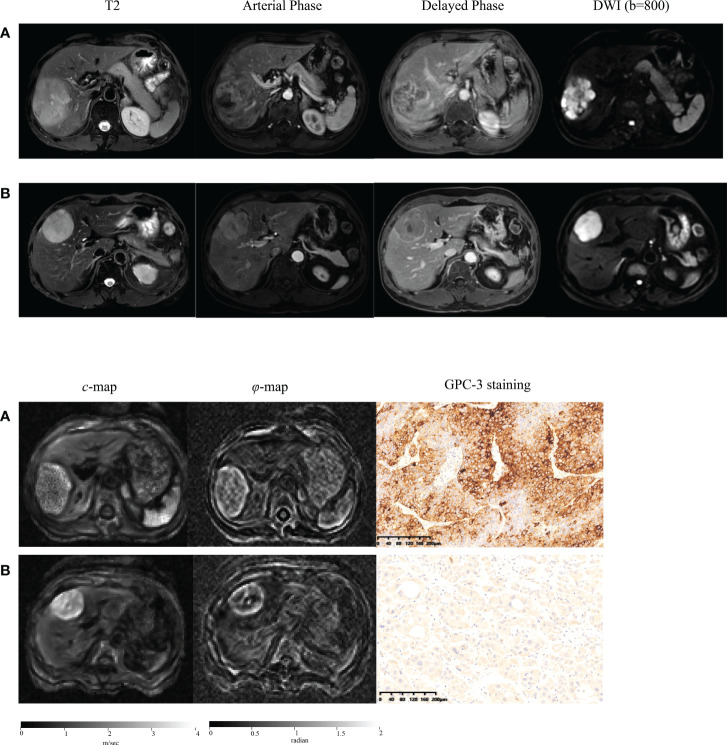
Figure 2.
Representative axial T2-weighted images; arterial phase images; delayed phase images; axial diffusion-weighted images (DWI) at b-value of 800 sec/mm2; axial tomoelastography c and φ maps, and immunochemistry-stained section images of tumors (magnification, ×20) obtained in a patient with GPC3-positive HCC (A) and in a patient with GPC3-negative HCC (B).

