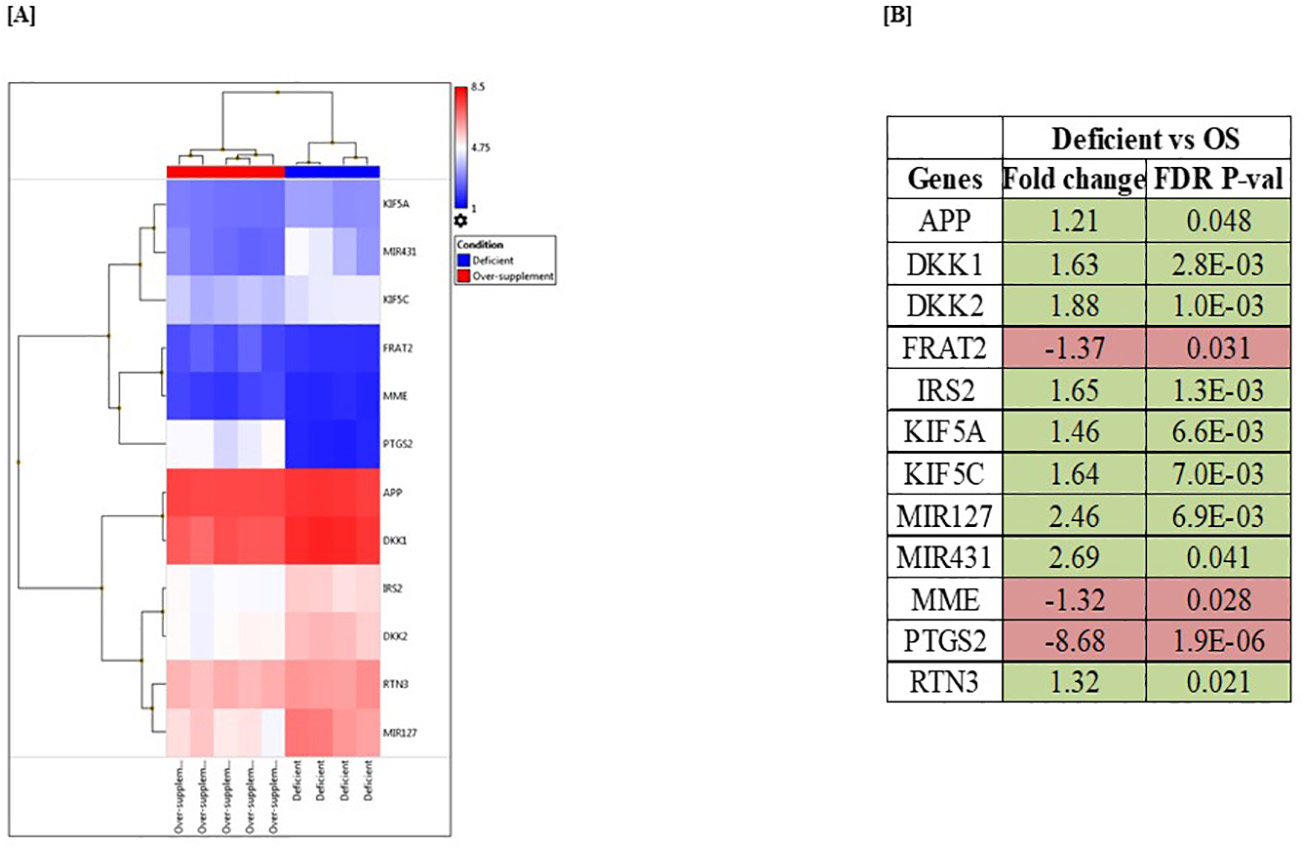
Fig. 10.

Microarray analysis of SH-SY5Y cells maintained (for 21 days) in thiamin-deficient and over-supplemented growth media. (A) Heatmap of differentially expressed genes associated with Alzheimer’s disease in thiamin-deficient and over-supplemented samples. (B) List of AD-related genes that were significantly altered in response to thiamin availability. Statistical significance of comparison was expressed as FDR P < 0.05 using the Transcriptome Analysis Console. Genes that are up- and down-regulated were highlighted in green and red, respectively.
