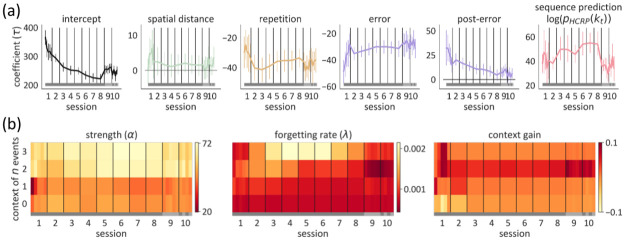
Fig 4. Fitted parameter values shown session by session, and at a subsession resolution in the initial and final sessions.
The grey band on the bottom of each plot shows the sequence that participants practiced: the old sequence in sessions 1–8 (dark grey), the new sequence in session 9 (light grey), and both sequences alternately in session 10. Point distance in (a) and cell width in (b) are proportional to data bin size—we fitted the model to 5 epochs within sessions 1, 9, and 10 to assess potentially fast shifts. (a) Fitted values of the response parameters in units of τ [ms]. The error bars indicate the 95% CI for the between-subjects mean. (b) Fitted values of the strength α (left) and forgetting rate λ (middle) parameters are shown, as well as their joint effect on prediction (right). A context of n previous events corresponds to level n in the HCRP. Lower values of α and λ imply a greater contribution from the context to the prediction of behavior. The context gain for context length n is the decrease in the KL divergence between the predictive distribution of the complete model and a partial model upon considering n previous elements, compared to considering only n − 1 previous elements. Note that the scale of the context gain is reversed and higher values signify more gain.

