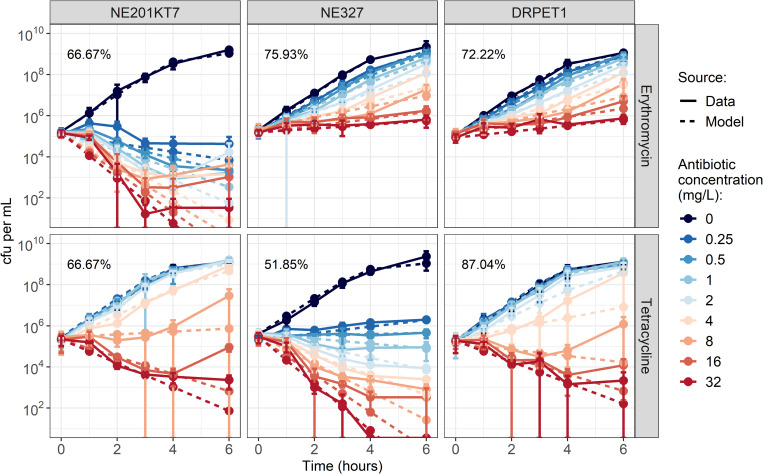
Fig 2.
Growth curves of NE201KT7 (tetracycline-resistant, left), NE327 (erythromycin-resistant, middle) and DRPET1 (double-resistant, right), exposed to varying concentrations of erythromycin (top) or tetracycline (bottom). Solid lines show in vitro data, with error bars indicating mean +/- standard deviation, from 3 replicates. Dashed lines show model output after fitting. Values indicate the percentage of model points that fall within the range of the corresponding in vitro data point +/- standard deviation. cfu: colony-forming units. Note that cfu per mL are shown on a log-scale.

