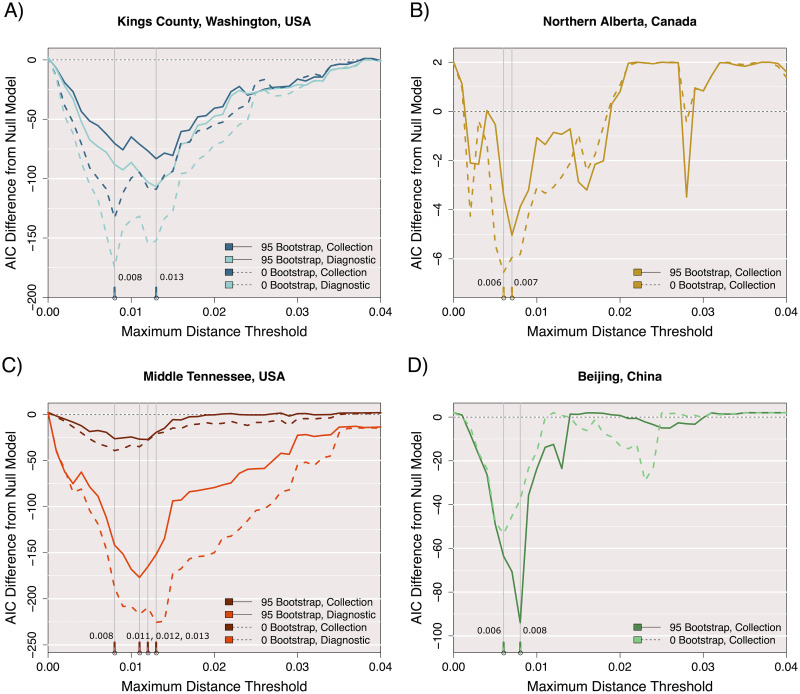
Fig 4. Effect of bootstrap thresholds on ΔAIC profiles.
The AIC difference between two Poisson-linked models of cluster growth for all four full data sets, with clusters and growth defined at 41 different maximum distance thresholds from 0 to 0.04. The AIC of a null model where size predicts growth is subtracted from the AIC of a proposed model where size and time predict growth. For the data sets where either sequence collection date or associated patient diagnostic date could define time, both AIC difference results are shown by separate colours. Solid lines represent AIC differences obtained using an additional bootstrap threshold of 0.95 to define clusters and growth, while dashed lines were obtained without this requirement.

