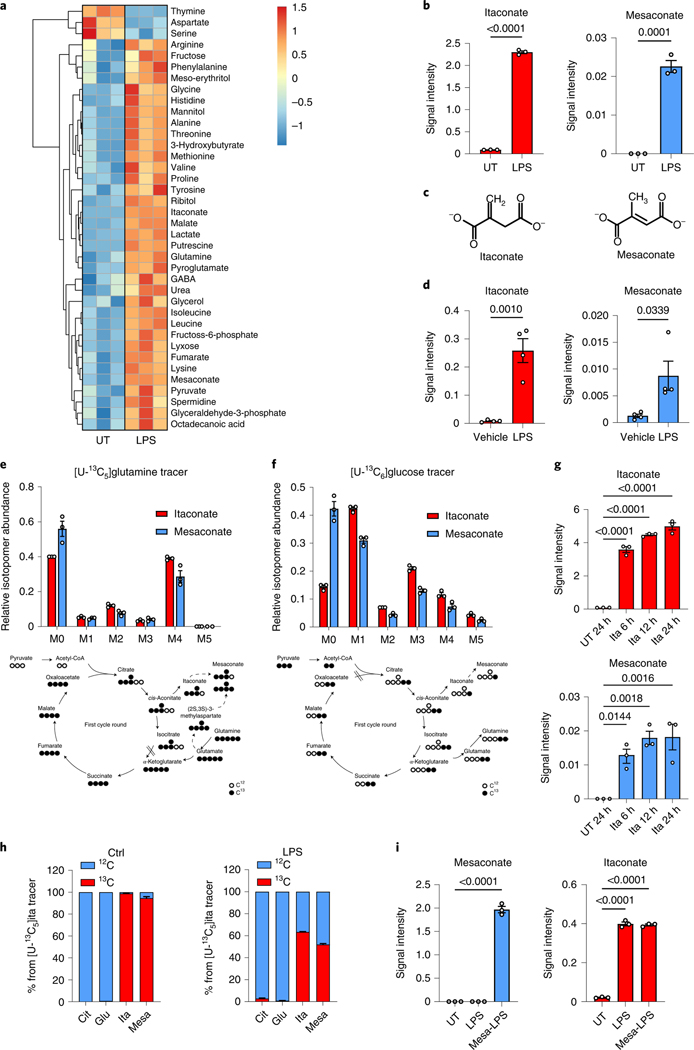
Fig. 1 |. Mesaconate is endogenously synthesized from itaconate in macrophages.
a, Non-targeted intracellular metabolome of mouse macrophage RAW264.7 cells in the absence or presence of 10 ng ml−1 LPS for 24 h. b, Signal intensity of intracellular itaconate and mesaconate in RAW264.7 cells. c, Chemical structure of itaconate and mesaconate. d, Intracellular levels of both metabolites in peritoneal cells isolated from mice intraperitoneally injected with 1 mg per kg body weight of LPS for 24 h. e,f, Mass isotopomer distribution of itaconate and mesaconate in RAW264.7 cells incubated with [U-13C5]glutamine (e) or [U-13C6]glucose (f) tracer for 24 h. Atom transitions for TCA cycle metabolites and potential mesaconate biosynthesis are indicated below. g, Intracellular levels of itaconate and mesaconate in RAW264.7 cells treated with 10 mM exogenous itaconate at the indicated time points. h, Carbon contribution of supplemented [U-13C5]itaconate to intracellular itaconate and mesaconate and mass isotopomer distribution of both metabolites in RAW264.7 cells incubated with [U-13C5]itaconate tracer for 24 h in the absence or presence of LPS. i, Intracellular levels of itaconate and mesaconate in RAW264.7 cells pretreated with 10 mM exogenous mesaconate for 4 h before 3 h LPS stimulation. Data are presented as a representative heat map showing z-scores of the data by row, from three independent experiments (a), the mean ± s.e.m. calculated from (b and e–i) n = 3 biological independent replicates from a representative experiment of two (e–g and i) or three (b and h) independent experiments or (d) n = 4 mice. UT, untreated control. P values were calculated by one-way analysis of variance (ANOVA) with Dunnet’s post hoc test (g and i) or unpaired t-test (b and d) and overlayed on respective comparisons.

