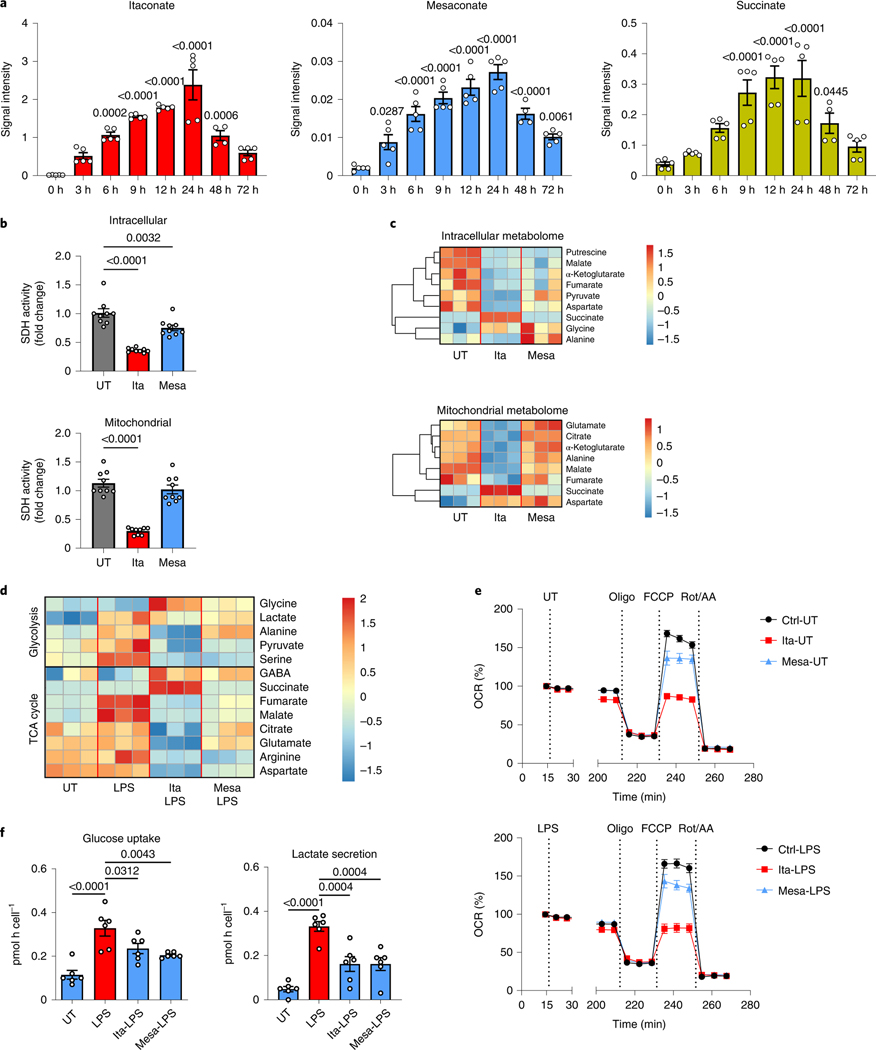
Fig. 2 |. impact of mesaconate and itaconate on macrophage metabolism.
a, Intracellular levels of itaconate, mesaconate and succinate in RAW264.7 cells stimulated with 10 ng ml−1 LPS for the indicated periods. b,c, Intracellular and mitochondrial SDH activities (b) and metabolomes (c) of RAW264.7 cells incubated with 10 mM itaconate or mesaconate for 6 h. d, Intracellular metabolome of RAW264.7 cells pretreated with 10 mM itaconate or mesaconate for 4 h before 3 h LPS stimulation. e, Oxygen consumption rate (OCR) of RAW264.7 cells pretreated with 10 mM itaconate or mesaconate for 4 h before 3 h LPS stimulation, followed by a sequential addition of oligomycin (Oligo), FCCP and rotenone plus antimycin A (Rot/AA). All values were normalized to the measurement time point 1 (immediately before LPS injection) of each well. Unnormalized results are shown in Extended Data Fig. 2b,c. f, Glucose uptake and lactate secretion of mouse BMDMs pretreated with 10 mM itaconate or mesaconate for 4 h before 21 h LPS stimulation. Data are shown as the mean ± s.e.m. calculated from n = 5 biological replicates from two independent experiments (a; except n = 4 for 48 h), n = 9 biological replicates from three independent experiments (b) or n = 6 mice from five independent experiments (f); a representative heat map showing z-scores of the data by row, from three independent experiments (c and d); and the mean ± s.e.m. calculated from n = 10 biological replicates from a representative result of three independent experiments (e). P values were calculated by one-way ANOVA with Dunnet’s post hoc test and overlayed on respective comparisons.

