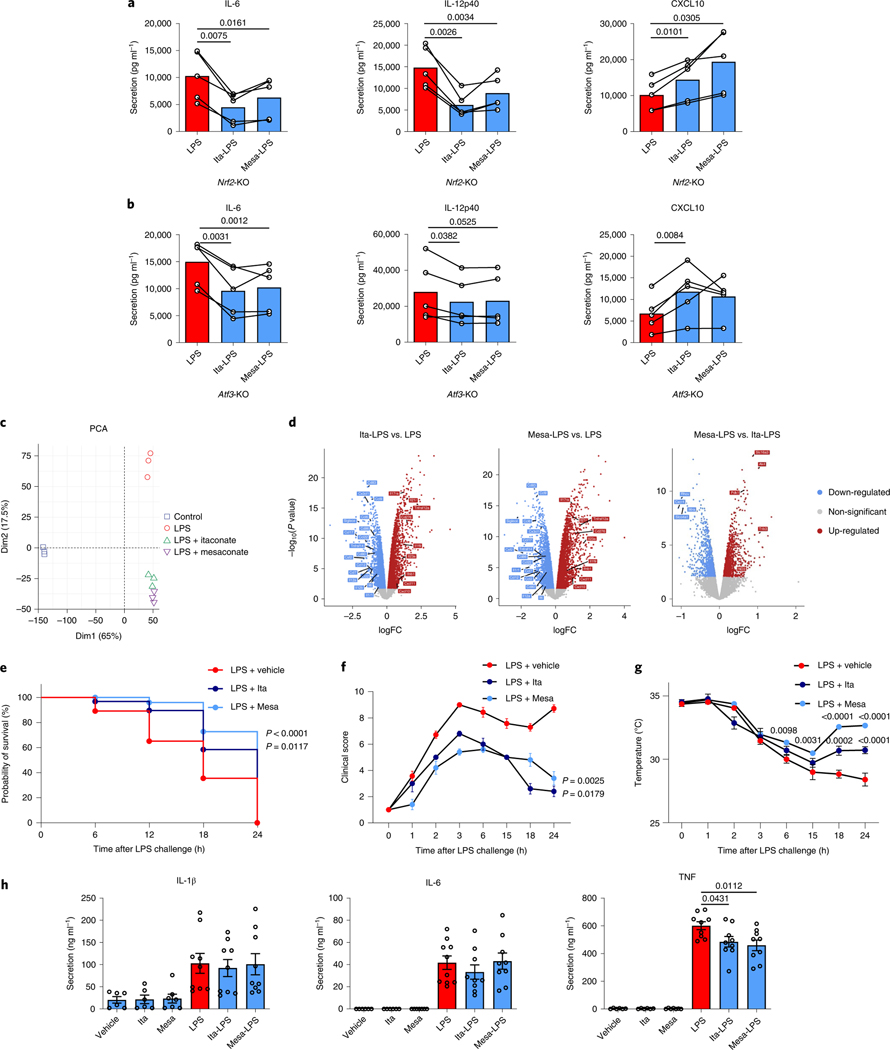
Fig. 4 |. itaconate and mesaconate modulate cytokine production in NRF2- and ATF3-deficient macrophages, and protect mice from LPs-induced sepsis.
a,b, Cytokine secretion of Nrf2-knockout (KO) (a) and Atf3-KO (b) BMDMs pretreated with 10 mM itaconate or mesaconate for 4 h before LPS stimulation for 21 h. c,d, Transcriptomic analysis with PCA (c) and volcano plots (d) of RNA-seq data from wild-type BMDMs pretreated with 10 mM itaconate or mesaconate for 4 h before 10 ng ml−1 LPS stimulation for 3 h. e–h, Itaconate and mesaconate protect from LPS-induced sepsis: survival curve (e), clinical score (f), body temperature (g) and plasma cytokines (h) in mice intraperitoneally injected with 250 mg per kg body weight itaconate or mesaconate for 2 h, followed by 30 mg (e) or 2.5 mg (f–h) per kg body weight LPS for 24 h. Data are presented as: a,b, the mean with data of individual mice from n = 5 mice (each data point represents a mouse) from two (a) or three (b) independent experiments, and conditions from individual mice are connected with a line; the relative distribution of overall transcriptome of different groups (c); x axis for the log-fold change (logFC) between two groups, y axis for the P value of corresponding comparisons, and the colouring is generic for P < 0.05 (d); probability of survival calculated from n = 20 mice per group, a representative result from two independent experiments (e); the mean ± s.e.m. was calculated from n = 7 mice for LPS + vehicle, n = 5 mice for LPS + itaconate/mesaconate, representative from three independent experiments (f and g); the mean ± s.e.m. calculated from n = 6 mice for no-LPS conditions and n = 9 mice for LPS conditions, pooled from two independent experiments (h). P values were calculated by paired t-test (paired by each mouse; a and b), an exact test based on the dispersion generated by the quantile-adjusted conditional maximum likelihood (qCML) method (d), curve comparison with log-rank (Mantel–Cox) test (e), one-way ANOVA with Dunnet’s post hoc test (f for curve mean and h) or two-way ANOVA with Dunnet’s post hoc test (g) and overlayed on respective comparisons.

