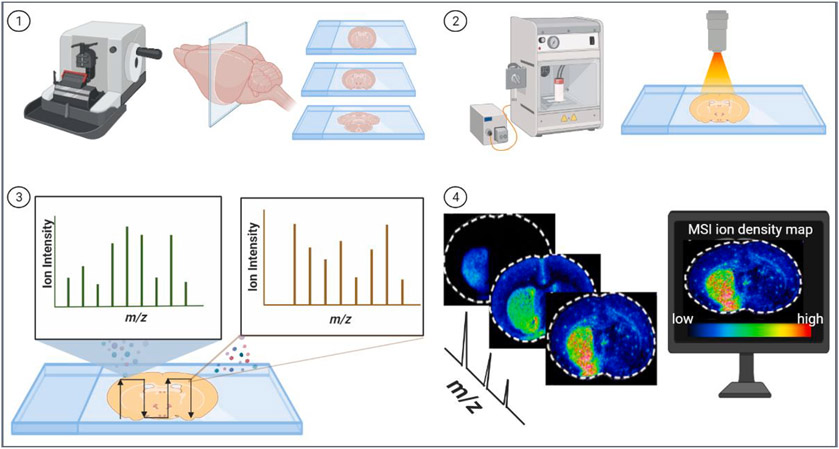
Fig. 1.
A typical workflow for spatial analysis of tissue section using matrix-assisted laser desorption/ionization (MALDI) mass spectrometry imaging (MSI). 1). Frozen or FFPE tissue sections are cut into thin sections on glass slides by microtome or cryostat. 2). Tissues sections are coated with an energy-absorbing matrix via a matrix sprayer and placed into the mass spectrometer. 3). A pulsed laser desorbs the tissue and ionizes molecules at different spots on the defined region of tissues. The m/z values of the ionized molecules are determined by mass analyzer. 4). The localization pattern of individual molecular species present on the tissue surface is extracted and positioned on the histological image of the tissue. MS images are generated by computer software based on molecules’ m/z ion intensities. The color reference bar represents the relative intensity of different ions. Each m/z image has its own intensity scale encoded with the blue (low intensity) to red (high intensity) color gradient.

