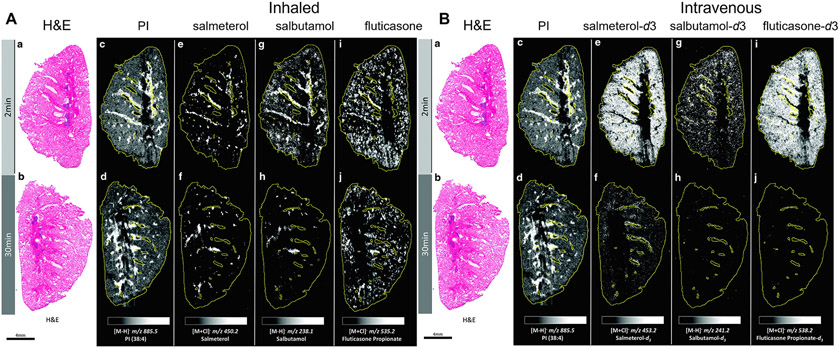
Fig. 10.
Whole-lung imaging by DESI-MSI in negative detection mode at 70 μm spatial resolution. (A) H&E-stained images from 2 (A-a) and 30 (A-b) minutes after administration through inhaled nebulization. Molecular images of endogenous (A-c, A-d) phosphatidylinositol (PI), inhaled (A-e, A-f) salmeterol, (A-g, A-h) salbutamol, and (A-i, A-j) fluticasone propionate. (B) H&E-stained images from 2 (B-a) and 30 (B-b) minutes after intravenous administration. Molecular images of endogenous (B-c, B-d) PI, intravenous-dosed (B-e, B-f) salmeterol-d3, (B-g, B-h) salbutamol-d3, and (B-i, B-j) fluticasone- d3 propionate. Intensity scale is fixed for each molecular species independently; monochromatic lighter colors correspond to higher relative abundance and darker to lower abundance. Tissue area is outlined in yellow line. Adapted with permission from [106]. Copyright 2020, Mary Ann Liebert, Inc.

