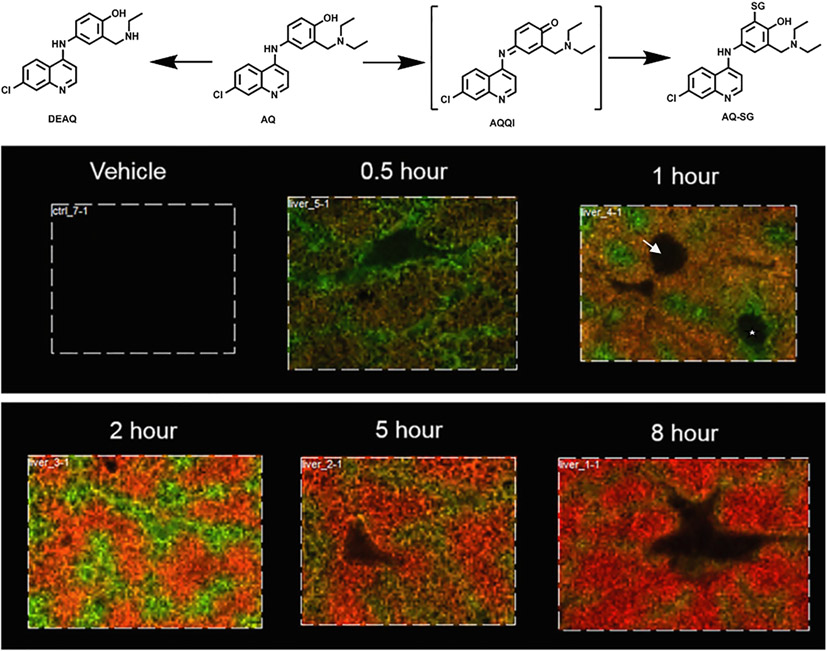
Fig. 13.
Amodiaquine (AQ) was metabolized to de-ethyl-amodiaquine (DEAQ) or the glutathione adduct (AQ-SG) in rat liver. MALDI-MSI with a 25 μm spatial resolution reveals zonation patterns in the liver lobule at different time points after a single 100 mg/kg oral dose. The distribution of AQ (green) and DEAQ (red) at 0.5, 1, 2, 5, and 8 h time points varied. Arrow indicates the central veins; * indicates a portal triad region. Adapted with permission from Grove, et al. 2018. Copyright 2022.

