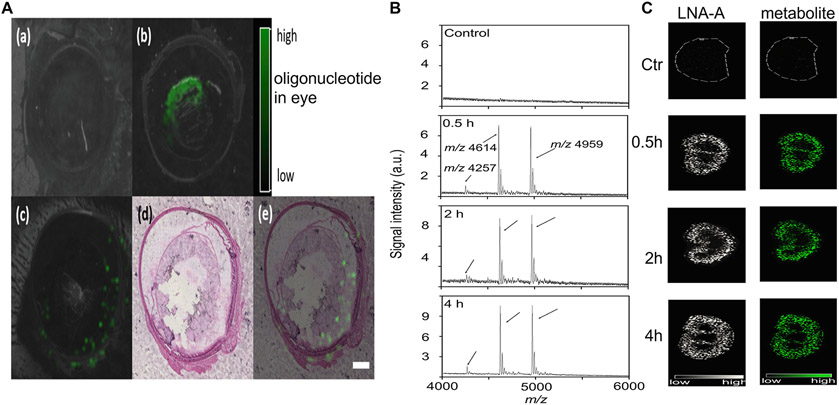
Fig. 14.
MALDI-MSI detection of oligonucleotide-based therapy. (A) The ion image of control rat eye section (A-a) and antisense oligonucleotide ASO-2 in rat eye sections immediately (A-b) or 30 min (A-c) after intravitreous injection of ASO-2 (500 μg). The [M─H]− of the ASO-2 at m/z 6683 was monitored. The eye section was stained with H&E (A-d) and merged with the ion image (A-e). Scan resolution: 150 μm. Printed with permission from [147]. Copyright 2022. (B, C) MALDI-MSI detection of an antisense oligonucleotide containing locked nucleic acids (LNA-A) in mouse kidney section after intravenous administration of LNA-A (1 mmol). (B) Mass spectra of control and 0.5, 2, and 4 h post-dose. (C) MS ion image of LNA-A (m/z 4959) and its metabolite (m/z 4614). Scale bar: 5 mm. Adapted with permission from [148]. Copyright 2022, Wiley.

