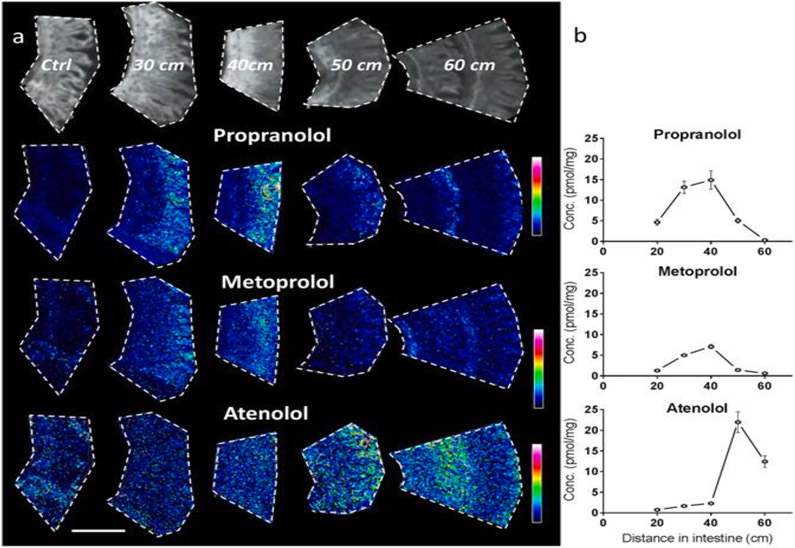
Fig. 4.
MALDI-MSI study of longitudinal (proximal to distal) and crypt-villus distribution of oral propranolol, metoprolol, and atenolol in rat small intestine. Images and concentration determinations from tissues collected 20 min post oral administration (1 μmol/kg) at different distances distal from the pyloro-duodenal transition. (a) MALDI-MSI ion distribution images of three drugs propranolol, metoprolol, and atenolol in intestine, scale bar is 1 mm. All tissue sections were analyzed at the same occasion and each compound is displayed with its own relative intensity scale (rainbow) with blue representing lower intensity and white representing highest intensity. (b) Homogenate concentrations (pmol/mg) measured by LC-MS/MS for the three drugs. X-error bars indicate position of the sampling ± 1 cm distal from the pyloro-duodenal transition. Printed with permission from [89]. Copyright 2022.

