Fig. 5.
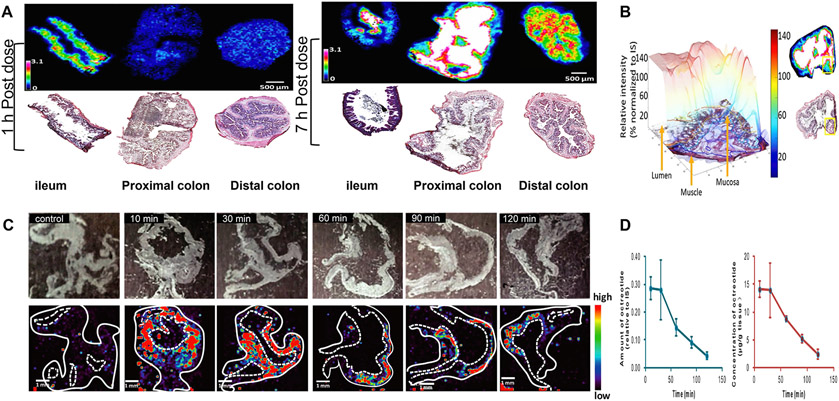
MALDI-MSI analysis of distribution of oral drugs in the intestine of rats following oral administration. (A) Distribution of oral tofacitinib in the ileum, proximal colon, and distal colon with corresponding Hematoxylin & Eosin (H&E) stains beneath MSI ion distribution images at 1 h and 7 h post-dose. The ion intensity signal was normalized to the signal of the isotope-labeled standard. (B) 3D intensity plot of the tofacitinib of the selected region in the proximal colon 7 h post-dose. Right-side images show the intensity distribution of tofacitinib and the H&E image of the entire section with the yellow box corresponding to the region used for 3D visualization. Arrows point to the muscle layer, mucosa, and lumen areas. Adapted with permission from [90]. Copyright 2022, ACS. (C) Representative optical and MALDI-MSI images of octreotide in mouse stomach section collected at various time points ranging from 10 min to 120 min after oral administration of octreotide. (D) Tissue concentration-time curve of octreotide in mouse stomach determined by MALDI-MSI (left panel, green) and by LC-MS/MS (right panel, red) to show similar pharmacokinetic curves using the different technologies (tissue imaging via MSI and tissue homogenate using LC-MS/MS). Adapted with permission from [91]. Copyright 2022.

