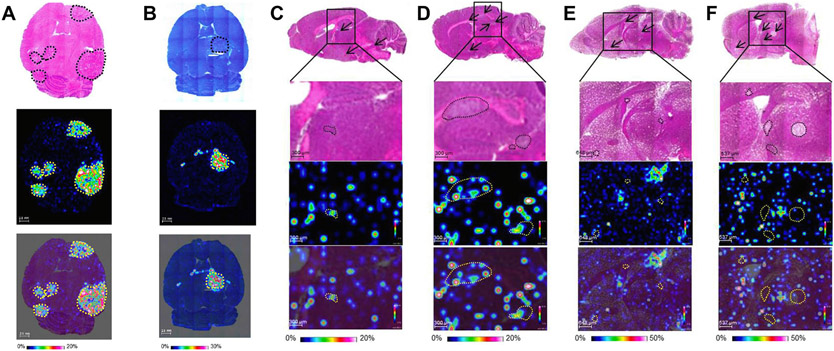
Fig. 7.
Quantitative analysis and distribution of anticancer drug epertinib and lapatinib in brain metastases using MALDI-MSI. Representative images of horizontal brain sections of mice with lung cancer brain metastases developed by intraventricular injection of NCI-H1975-luc cancer cells and stained with H&E (A top row) and giemesa staining (B top row) with the black dashed lines indicating tumor position. The ion images of epertinib (A, middle row) and lapatinib (B, middle row) in brain section at 4 h after oral administration of epertinib hydrochloride or lapatinib ditosylate monohydrate at a dose of 100 mg/kg. The overlay images of MSI of epertinib (A, lower row) and lapatinib (B, lower row) on the stained images. Distribution of epertinib and lapatinib in BR3 breast cancer brain metastases shown at 4 h (C) and 8 h (D) post dose of epterinib hydrochloride (50mg/kg) and 4 h (E) and 8 h (F) post dose of lapatinib ditosylate monohydrate (50mg/kg). (C-F) top row showing H&E staining, middle row is the ion images of epertinib and lapatinib and the bottom row is the overlay of the ion images on the H&E stain. Arrows indicate tumor position of the choroid plexus, black and yellow dashed lined indicate tumor region. Adapted with permission from [94]. Copyright 2022.

