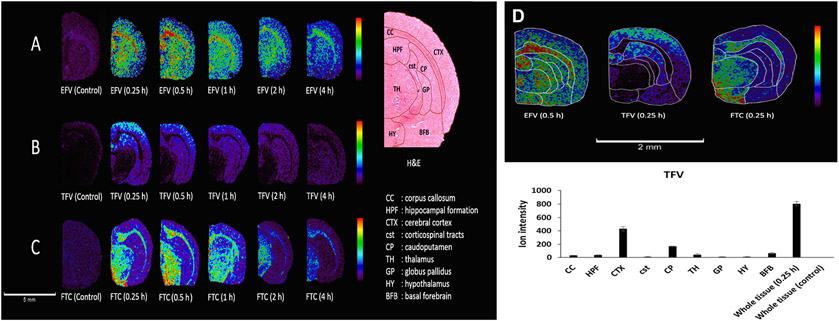
Fig. 8.
MALDI-MSI analysis of regional brain distribution of three antiretroviral drugs efavirenz (EFV), tenofovir (TFV), and emtricitabine (FTC) in the rat brain after intraperitoneal administration. MSI images of time dependent spatial distribution of EFV (A), IFV (B), and FTC (C) in coronal rat brain sections with a spatial resolution of 100 μm. H&E staining with regional labels to define regions of interest. (D) Relative ion abundance of the three drugs in different brain regions (top panel) and a representative TFV ion intensity plot at 0.5 h post-dose. Scale bar: 2 mm. CC: corpus callosum; HPF: hippocampal formation; CTX: cerebral cortex; cst: corticospinal tracts; CP: caudoputamen; TH: thalamus; GP: globus pallidus; HY: hypothalamus; BFB: basal forebrain. Adapted with permission from [96]. Copyright 2022 ACS.

