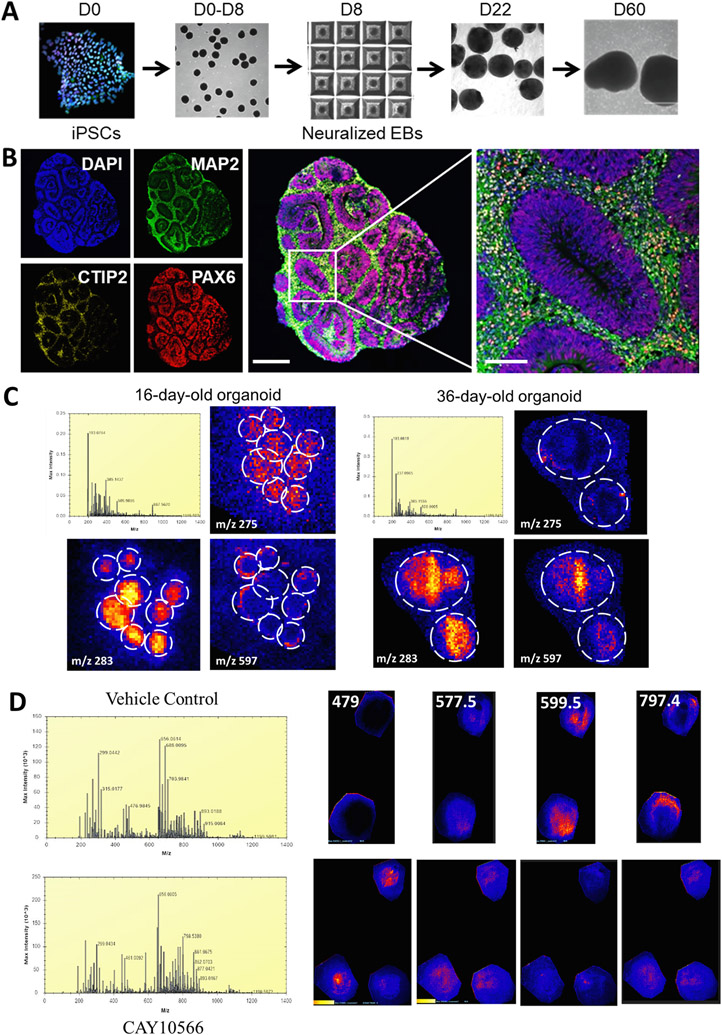
Fig. 9.
MSI can be used to characterize small molecule/metabolome changes in human brain organoids. A. iPSCs grown on feeders are transferred into low-attachment AggreWell 800 to develop about 300 embryoid bodies (EBs) per batch. To achieve rapid and efficient neural induction, both the bone morphogenetic protein (BMP) and transforming growth factor beta (TGF-β) signaling pathways are inhibited with small molecules, dorsomorphin and SB-431542, respectively. On day 8, the floating spheroids were moved to suspension dishes and serum-free media containing fibroblast growth factor-2 (FGF2) and ascorbic acid. To promote differentiation of neuro-progenitors into neurons, FGF2 was replaced with brain-derived neurotrophic factor (BDNF) and neurotrophic factor 3 (NT3) starting on day 22 to 60, after which we used only neural medium without growth factors. B. These organoids contain ventricular zone-like regions consisting of PAX6 + cells surrounded by MAP2 + and CTIP2 + neurons. Scale bars: low mag 500 μm, high mag 100 μm. C. MSI of 16- and 36-day old organoids detects differences in the abundance and distribution of metabolites. We used MALDI-TOF (Synapt 2G-Si HDMS, Waters) calibrated for the mass range from m/z 50–2000 Da. Laser power was set to 250 (arb units) with 300 laser shots per pixel. The laser raster step was set to 60 μm to match the laser spot size of 30 μm. Tissue was processed as published [103] and sections (14 μm) were coated with the MALDI matrix 9-aminoacridine. The coated slides were rehydrated in a heated humidifying chamber for 2 min. Before loading the slide into the MS, the slide was scanned with an EPSON scanner to map the areas of interest into the High Definition Imaging (HDI) 1.4 software and the data were acquired in negative ionization mode. 16d and 36d organoids have different metabolome profiles, as seen by the mass spectrometry data (upper panels). Individual metabolites (red-yellow signal) were visualized in the organoids (m/z listed in the corner; yellow indicates higher concentration than red). Blue signal originates from the matrix. In the 16 day sample, 8 organoids are seen (they were small and more can fit on the slide), while in the 36 day sample, 2 organoids occupied the same area. D. 60-day-old organoids were treated with CAY10566, an inhibitor of the stearoyl-CoA desaturases that catalyze the conversion of saturated fatty acids into monounsaturated fatty acids, for 3 days. Tissue was processed and MSI performed as in (C). We could observe differences in the content, abundance, and distribution of metabolites (m/z listed in the corner).

