. 2022 Dec 2;11:e79811. doi: 10.7554/eLife.79811

Figure 6. VPS9D1-AS1 overexpression (OE) cells inhibited T cell function in vivo.

(A) VPS9D1-AS1 OE promoted the expression of TGF-β, TGFBR1, SMAD1, and STAT1 in murine cells. (B) MC38 VPS9D1-AS1 OE and control (CTRL) cells were determined proliferation using CCK8 assays. (C) Growth curves of MC38 allograft tumors (n=7 per group). (D) Plots represent the percentages of CD8+ and CD4+ T cells and PD1 frequencies in allograft tumors and spleens. (E) Levels of CD8+ and CD4+ T cells were compared in the tumor and spleen. (F) Levels of PD1 in CD4+ T and CD8+ T cells were compared between CTRL and VPS OE allograft tumors (left) and spleens (right). p-Values were obtained by two-way ANOVA (B) and unpaired t nonparametric tests (E, F). Data are shown as the mean ± SEM (E, F). **p<0.01, ***p<0.001.

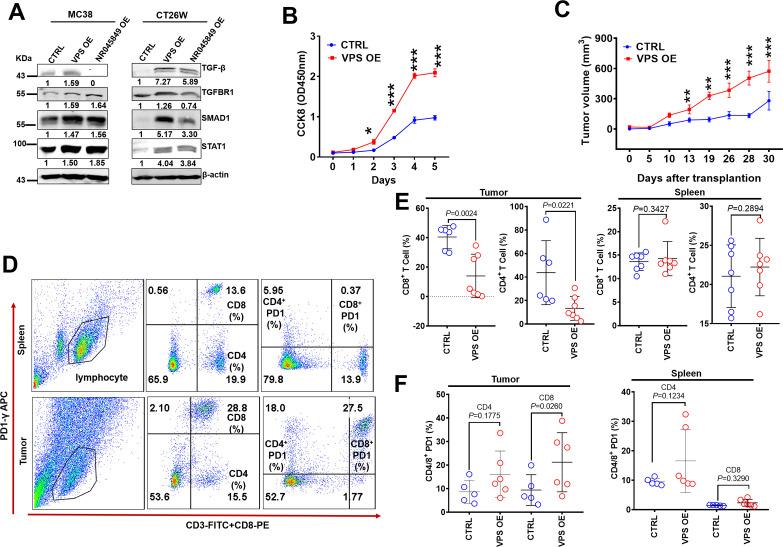
Figure 6—source data 1. TGF-β, SMAD1, STAT1, TGFBR1, and β-actin western blot for Figure 6A.

Figure 6.

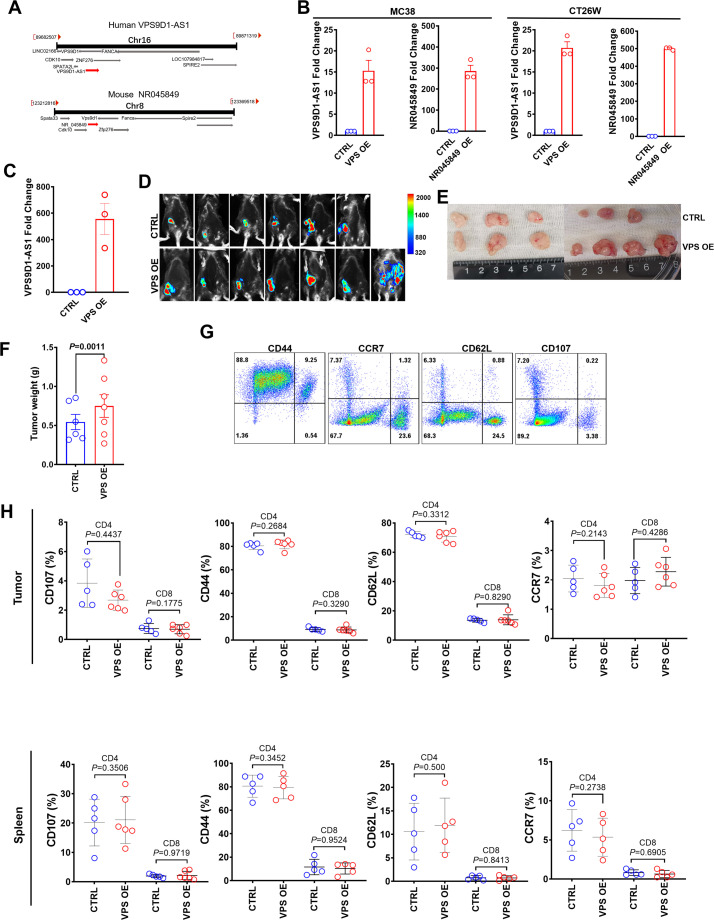
Figure 6—figure supplement 1. VPS9D1-AS1 inhibited T-infiltrating lymphocyte in allograft tumors.

Figure 6—figure supplement 1.

(A) Schematic of human VPS9D1-AS1 and murine NR045849 locations on the chromosome. (B) Fold changes in the expression levels of VPS9D1-AS1 and NR045849 in MC38 and CT26W cells. (C) qRT-PCR confirmed the overexpression of VPS9D1-AS1 after three transfections with lentivirus vectors in MC38 cells. (D) In vivo imaging showed transplanted MC38CTRL and MC38VPS-OE allograft tumors. (E) Allograft tumors were harvested 35 days after injection (one mouse in the control [CTRL] group did not form tumors). (F) Allograft tumor weights for MC38CTRL and MC38VPS OE. (G) Representative flow cytometry results of CD44, CD62L, CD107, and CCR7 in CD4+ and CD8+ T cells. (H) Comparisons of the levels of CD44, CD62L, CD107, and CCR7. p-Values were obtained by unpaired t test (F, H). Data are shown as the mean ± SEM (F, H).