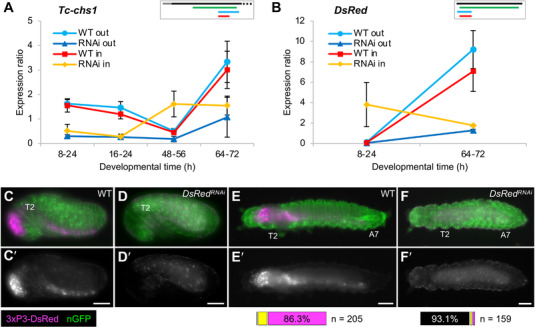
Figure 2.

Maternal transmission of dsRNA occurs for diverse genes with distinct expression profiles. A,B) RT‐qPCR expression ratio assayed with amplicons that are nested (“in”: red and yellow) or partially outside (“out”: light and dark blue) with respect to the dsRNA fragment, in wild type and after RNAi, as indicated in the legends. Mean expression levels are shown from three biological replicates; error bars represent ± one standard deviation. For Tc‐chs1 (A), the nested qPCR amplicon shows higher expression in RNAi samples (yellow) when endogenous Tc‐chs1 expression is low (48–56 h). Similarly, in the nGFP strain expressing transgenic dsRed (B), the DsRed nested qPCR amplicon detects more RNA in the RNAi than wild type samples at a stage when the DsRed transgene is not expressed (8–24 h). Inset schematics depict the transcript, dsRNA, and qPCR fragments to scale, using the same color scheme as in Figure 1; only the first 700 bp of the 5092‐bp mRNA is shown for Tc‐chs1. C–F) Phenotypic confirmation of DsRed knockdown through loss of DsRed fluorescence in a transgenic line that ubiquitously expresses nuclear‐localized GFP (green). The 3xP3 core promoter drives DsRed signal (magenta) in the brain and ventral nerve cord of untreated control (WT) embryos (C) and larvae (E). After DsRed RNAi, 3xP3‐driven DsRed signal is absent, with only weak autofluorescence detected in the epidermal cuticle and the yolk (D,F). Views are lateral (C,D) or dorsal (E,F), with anterior left and, as applicable, dorsal up. Landmark thoracic (T) and abdominal (A) segments are numbered. Letter‐prime panels show the DsRed channel alone. Scale bars are 100 µm. Horizontal bar charts show the proportions of larvae with no (black), weak (yellow), or strong (magenta) DsRed signal in larvae (n = 205 for WT, n = 159 for RNAi).
