Figure 3.

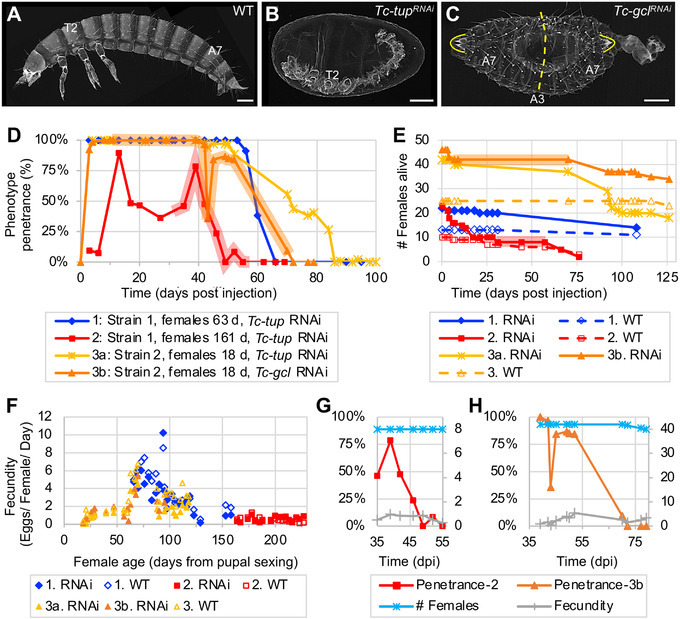
Systemic parental RNAi persists at high levels for months before fully waning. A–C) Representative larval cuticle preparations for wild type (WT), Tc‐tupRNAi , and Tc‐gclRNAi (from Experiment 3, collected 39–52 dpi, assayed ≥6 days after egg lay). Views are lateral (A,B) or dorsal‐lateral (C), with anterior left and dorsal up. Landmark thoracic (T) and abdominal (A) segments are numbered. The dashed line indicates the plane of symmetry in the Tc‐gclRNAi mirror‐image double abdomen phenotype; brackets outline the terminal urogomphi. Scale bars are 100 µm. D) Time courses of parental RNAi penetrance from experiments that differ in beetle strain, female age, and target gene for knockdown (see figure legend and Experimental Section). Data points represent minimum age after injection, with n ≥ 10 eggs in each sample (see Experimental Section). Shaded plot segments for Experiments 2 and 3b represent time intervals with dynamic changes in RNAi penetrance that encompass both transient fluctuations (increase or decrease) and the interval of RNAi waning, while female population size was constant (no fatalities). E) Survival curves for females from all treatment conditions from all three experiments. For Experiments 2 and 3b, respectively, the red and orange shading corresponds to the same intervals as in (A). F) Fecundity values (number of eggs per female per day) relative to female age from all treatment conditions in all experiments, assayed at 19–26 time points per treatment. G,H) Juxtaposition of phenotype penetrance (%, left y‐axis) with female population size and fecundity values (integer values, right y‐axis) for the period of RNAi waning in Experiments 2 and 3b (red and orange shaded intervals, as above): female population size and fecundity remain steady or exhibit only minor fluctuation while RNAi wanes.
