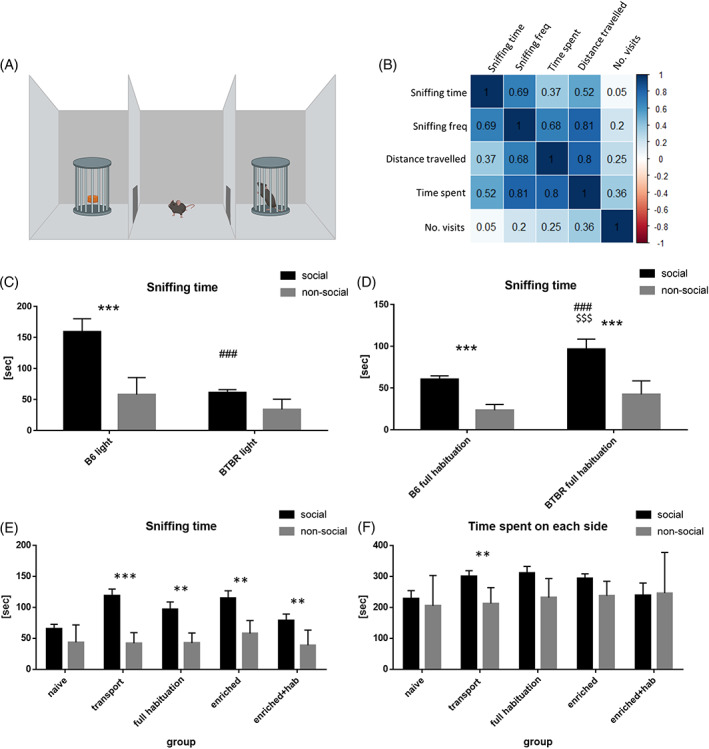
FIGURE 1.

Social affiliation scores in the three chambered apparatus depend on stressfulness of testing conditions. (A) The schematic of the apparatus. (B) Correlation matrix for behavioral parameters scored manually (BehaView) and with the use of automated animal positioning software (EthoVision XT9) in all BTBR groups (n = 63). Values/colors represent r—Pearson correlation coefficients for pairwise comparisons. (C) Time spent by B6 (n = 10) and BTBR (n = 12) mice on sniffing social and non‐social stimuli in bright light conditions (540 lux). (D) Time spent by c57 (n = 12) and BTBR (n = 10) mice on sniffing social and non‐social stimuli in dim light conditions (25 lux) in groups submitted to habituation to both transportation and handling by the Experimenter. (E) The effect of behavioral manipulations on sniffing of stimuli by BTBR mice tested in dim light conditions (25 lux): naïve (n = 10), mice habituated to transportation alone (n = 12), mice habituated to both transportation and handling by the Experimenter (n = 10), mice previously living in the enriched environment of the Intellicage (TSE, DE) system (n = 10), mice previously living in the Intellicage (TSE, DE) system and then habituated to both transportation and handling by the Experimenter (n = 9). (F) The effect of behavioral manipulations on time spent on either side of the apparatus (social vs. non‐social) by BTBR mice (the same groups as in (E)). For (C)–(F), data are presented as mean ± SEM with black columns representing soc side and gray columns representing non‐soc side of the apparatus. For (C)–(D), ANOVA was followed by Holm‐Sidak multiple comparison test, *** indicates p < 0.001 for within strain comparison (soc vs. non‐soc), ### indicates p < 0.001 for between strain comparison (B6soc vs. BTBRsoc), $$$ indicates p < 0.001 for between strain comparison (B6non‐soc vs. BTBRsoc). For (E)–(F), paired t‐test or Wilcoxon matched‐pairs signed‐rank test were used, ** indicates p < 0.01, *** indicates p < 0.001
