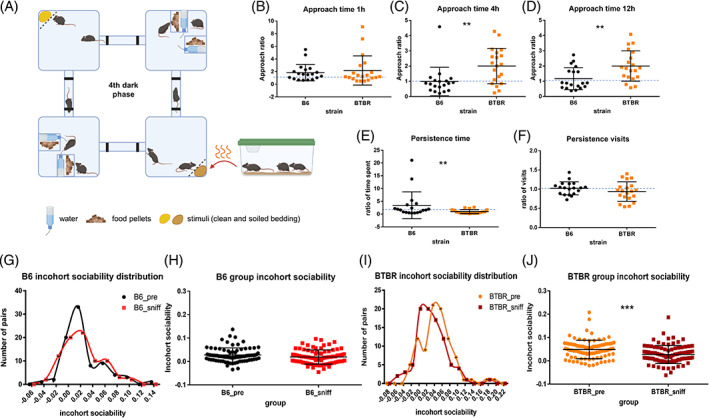
FIGURE 2.

Difference in social affiliation displayed in response to scented bedding from a cage of unfamiliar B6 mice. (A) The schematic of the Eco‐HAB system on scent deposition day with marked bottle, feeder and bedding used as social stimulus (clean/control in yellow, soiled/social scent in brown). (B) Approach time during the first hour after deposition of the social scent. (C) Approach time during initial 4 h after deposition of the social scent. (D) Approach time during the entire dark phase following deposition of the social scent. (E) Persistence in the time spent in the compartment with the social stimulus. (F) Persistence in the number of visits to the compartment with the social stimulus. (G) Distribution of incohort sociability scores for B6 mice before and after presentation of social scent. (H) Lack of change in incohort sociability in B6 mice in response to the social scent. (I) Distribution of incohort sociability scores for BTBR mice before and after presentation of social scent. (J) Shift to lower values of incohort sociability in BTBR mice in response to the social scent. Group sizes for all comparisons: B6 n = 19, BTBR n = 20. Differences in (B)–(F) were assessed with either unpaired t‐test or U‐Mann Whitney test. ** indicates p < 0.01. Pairwise differences in incohort sociability (H and J) were assessed with Kolmogorow‐Smirnov test, *** indicates p < 0.001
