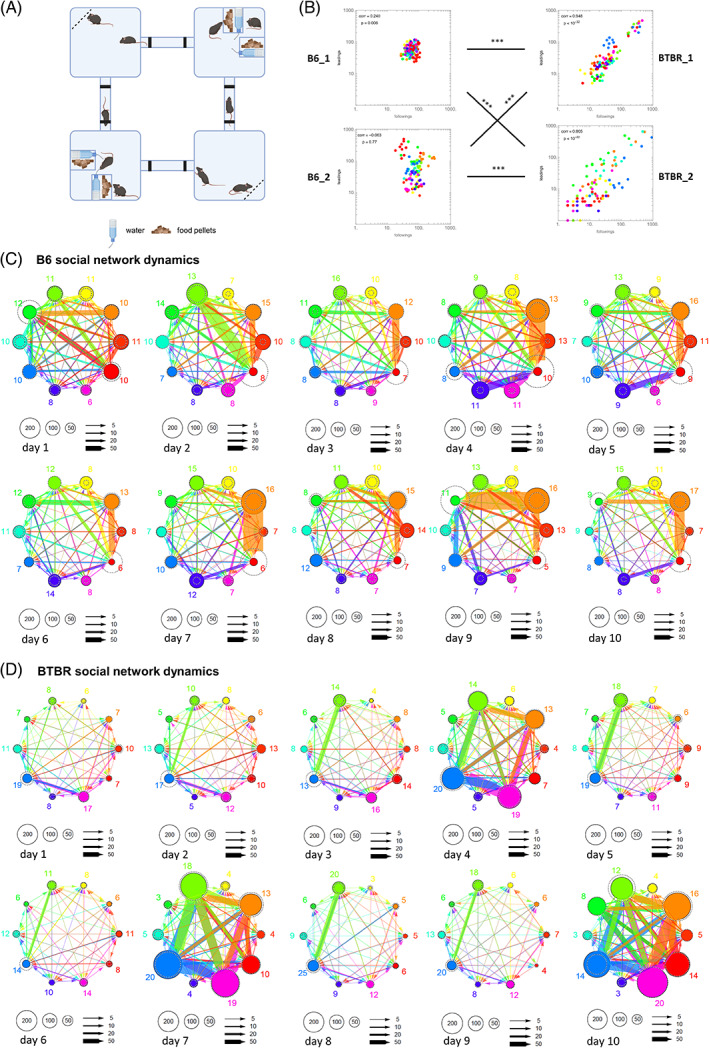
FIGURE 3.

Social network dynamics is different in B6 and BTBR mice. (A) The schematic of the Eco‐HAB. The activity of mice was recorded for 10 days with no intervention or scent deposition. The bottle and feeder are indicated with symbols described in the legend. (B) Correlation of following and leading episodes measures for 10 consecutive days in four cohorts (B6_1 n = 13, B6_2 n = 10, BTBR_1 n = 10 and BTBR_2 n = 10). Pearson correlation coefficient and p values are given for each graph. The differences in the distribution of ranks between cohorts were assessed with Spearman correlation coefficient. (C) Visualization of social network dynamics in B6 cohort no. 2 (n = 10) over 10 consecutive days. (D) Visualization of social network dynamics in BTBR cohort no. 1 (n = 10) over 10 consecutive days. Graphs in (C)–(D) depict the strength of interaction between pairs of animals in each cohort: the size of the solid circle represents the number of times a mouse followed other mice, the size of the dashed circle represents the number of times the given mouse was followed by another individual. The thickness of arrows connecting pairs of mice represents the strength of their interaction. The color‐matched numbers by each node represent PageRanks (shown as %), that is, weights of nodes in directed following graphs.
