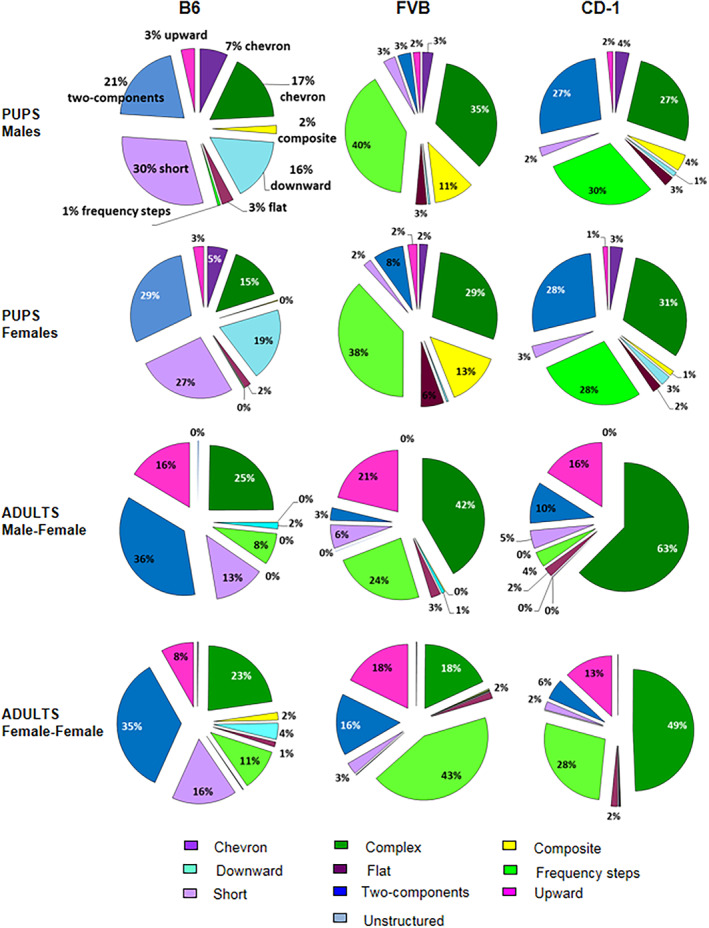
FIGURE 4.

Distributions of call categories in pup B6, FVB and CD‐1 (at pnd 8) and adult B6, FVB and CD‐1 during each type of social encounter. Pie graphs display the percentages of the different call categories within each strain for male pups at pnd 8, female pups at pnd 8, adult male–female, and female–female social interactions. Percentages were calculated in each strain as number of calls in each category for each subject/total number of calls analyzed in each subject.
