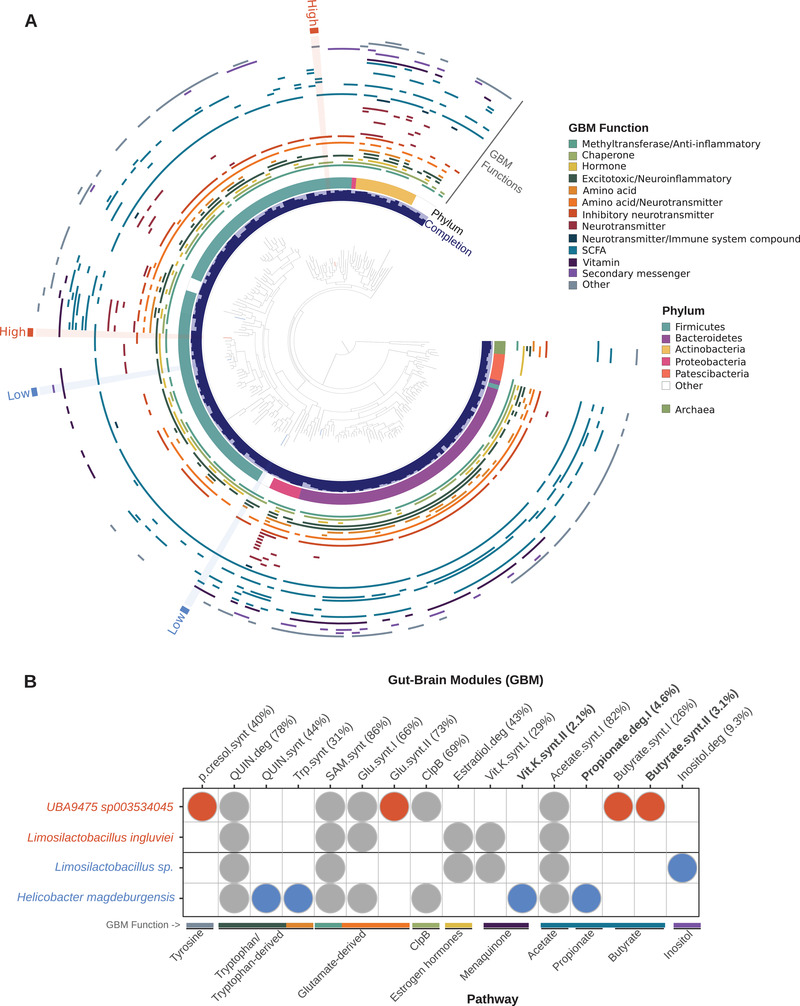
Figure 3.

Gut–brain module (GBM) distribution in red junglefowl metagenome‐assembled genomes (MAGs). A) Maximum‐likelihood phylogenetic tree comprising 194 gut‐associated MAGs identified in 45 red junglefowl fecal samples (HF: n = 22, LF: n = 23). The innermost circular layer represents the percent completion of each genome followed by the associated phylum in the second layer. The following middle layers represent the 41 gut–brain modules (GBMs) detected in the collections of MAGs and categorized by functional association. Six MAGs were differentially abundant or exclusive to a behavioral phenotypic group and highlighted on the tree based on the enrichment in either the high fear (orange) or the low fear (blue) selection line. B) Detection of GBMs in the six differentially occurring MAGs highlighted in (A). The numbers in parentheses correspond to the frequency of the GBM found in all MAGs and values in bold were considered rare (present in <5% of the MAGs). Pathways and functions were annotated for each GBM along the bottom x‐axis. GBMs exclusively present in MAGs enriched in the high fear group are highlighted in orange and those in the low fear group are highlighted in blue.
