
FIGURE 3.
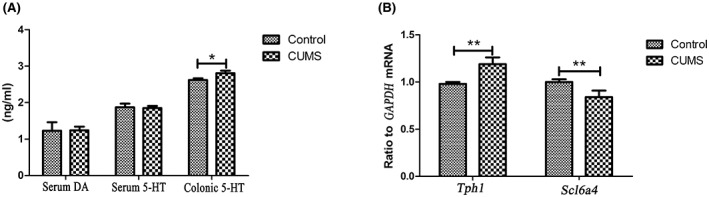
Comparison of serum DA, 5‐HT, colonic 5‐HT levels and the expression of Tph1 and Scl6a4 in both groups
Official websites use .gov
A
.gov website belongs to an official
government organization in the United States.
Secure .gov websites use HTTPS
A lock (
) or https:// means you've safely
connected to the .gov website. Share sensitive
information only on official, secure websites.
Comparison of serum DA, 5‐HT, colonic 5‐HT levels and the expression of Tph1 and Scl6a4 in both groups