
Figure 9.
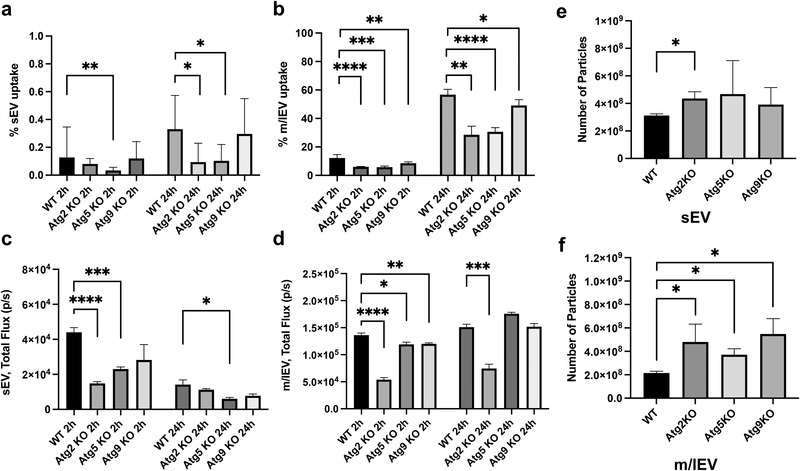
Decreased EV uptake and increased EV release by blocking autophagy in vitro. Uptake of PalmReNL‐sEVs or ‐m/lEVs in control and autophagy knockout (KO) cell lines, analyzed by flow cytometry and measuring bioluminescence. a,b) Flow cytometric analysis of cellular uptake of PalmReNL‐EVs (tdTomato+) in U2OS Atg KO cells relative to the parental U2OS cells (WT). The fold change of EV uptake was calculated using tdTomato fluorescence signals in KO cells compared to WT. Error bars, SD (n = 3), *p < 0.05; **p < 0.01; ***p < 0.001; ****p < 0.0001. c,d) Uptake of PalmReNL‐EVs determined by measuring bioluminescence signals. Error bars, SD (n = 4), *p < 0.05; **p < 0.01; ***p < 0.001; ****p < 0.0001. e) The release of sEVs assessed by NTA increased at the 72 h time point in the Atg2‐KO cell line only. f) The release of m/lEVs increased significantly in all the autophagy KO cell lines compared to WT. Error bars, SD (n = 3), *p < 0.05.