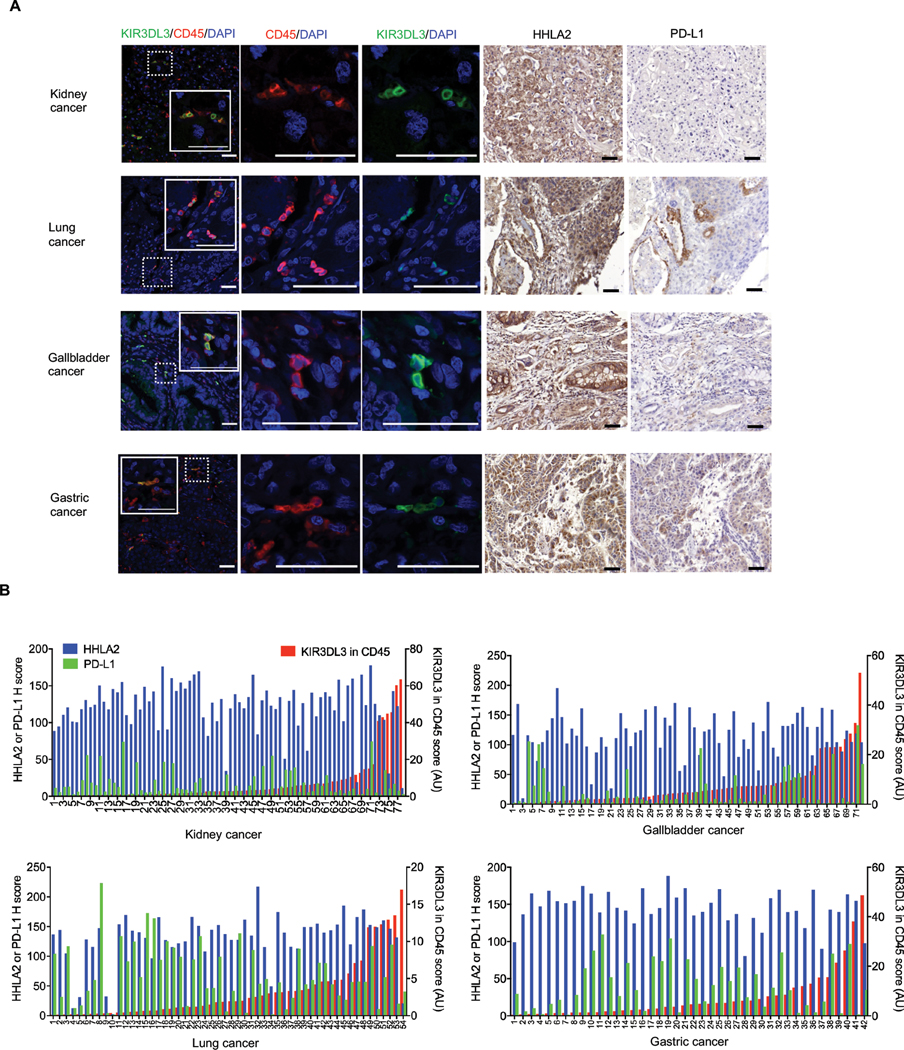
Fig. 6. Human HHLA2+ tumors were infiltrated by KIR3DL3+ immune cells.
(A) Representative images from the indicated cancer type (taken from the patients in B) showed co-expression of KIR3DL3 and CD45 detected by immunofluorescence (left), expression of HHLA2 and PD-L1 detected by immunohistochemistry (right). Scale bars, 50 𝜇m.
(B) Quantitative analysis of KIR3DL3 (QIF score, red, right Y-axis), HHLA2 (H score, blue, left Y-axis) and PD-L1 (H score, green, left Y-axis) expression on kidney (n=78), gallbladder (n=72), lung (n=54), and gastric (n=42) tumors from cancer patients.

