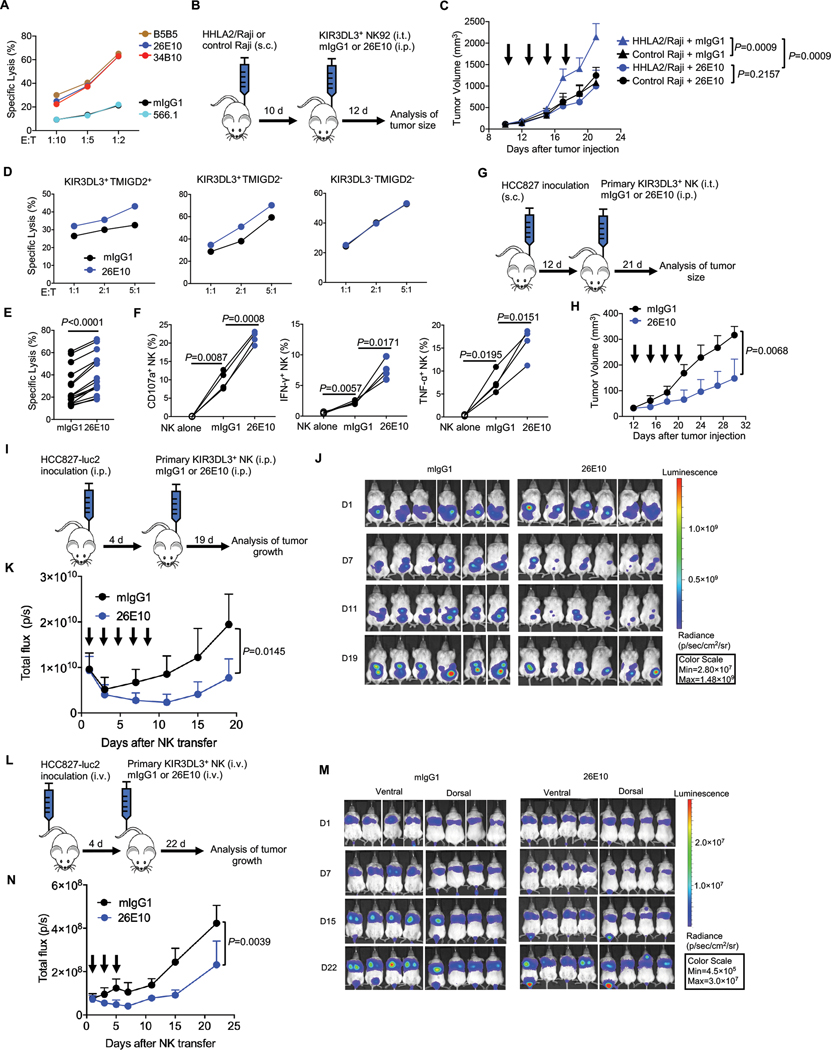
Fig. 7. KIR3DL3 blockade promoted NK cell anti-tumor immunity in vitro and in vivo.
(A) The lysis of HHLA2/K562 by KIR3DL3+ NK92 cells in the presence of anti-KIR3DL3 mAbs (clone 26E10 and 34B10) or anti-HHLA2 mAbs (clone B5B5 and 566.1) at an E: T=5:1. Data are mean for duplicate measurements.
(B-C) Subcutaneous Raji mouse model treated with NK92 cells. (B) Outline of the experiment procedure. (C) The tumor growth in the treatment of 26E10 or mIgG1 (n=4). Each arrow indicates treatment with NK92 cells and the antibody. Mean tumor volumes ± SD are shown.
(D) The indicated primary NK cells cytotoxicity against HCC827 at indicated E:T ratios in the presence of 26E10 or mIgG1. Data are mean for duplicate measurements.
(E-F) The cytotoxicity (E) (n=15), degranulation (CD107a) and cytokine production (IFN-γ and TNF-α) (F) (n=4) of primary KIR3DL3+ NK cells against HCC827 in the presence of anti-KIR3DL3 (26E10) or mIgG1 at an E: T=10:1.
(G-H) Subcutaneous HCC827 mouse model treated with primary KIR3DL3+ NK cells. (G) Outline of the procedure. (H) The tumor growth in treatment of the 26E10 or mIgG1 (n=4). Each arrow indicates treatment with primary KIR3DL3+ NK cells and the antibody. Mean tumor volumes ± SD are shown.
(I-K) Intraperitoneal HCC827 tumor model treated with primary KIR3DL3+ NK cells. (I) Outline of the procedure. (J) Bioluminescence images by ventral imaging of each mouse at indicated days. (K) Tumor growth in the 26E10 or mIgG1 treatment group (n=6). Each arrow indicates treatment with primary KIR3DL3+ NK cells and the antibody. Data are mean ± SD of the total flux from ventral imaging for each mouse.
(L-N) HCC827 lung metastasis mouse model treated with primary KIR3DL3+ NK cells. (L) Outline of the experiment procedure. (M) Bioluminescence images by dorsal and ventral imaging of each mouse at indicated days. (N) Tumor growth in the treatment of 26E10 or mIgG1 group (n=4). Each arrow indicates a treatment with primary KIR3DL3+ NK cells and the antibody. Data are mean ± SD of the average of total flux from dorsal and ventral imaging for each mouse.
Data are representative of three (A, D) or two (C, H, K, N) independent experiments. P values by a two-way ANOVA (C, H, K, N), a two-tailed paired t-test (E) and a one-way ANOVA (F).

