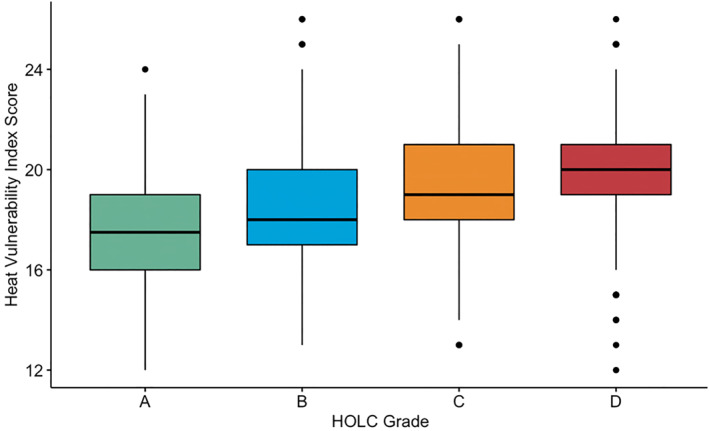
Figure 2.

Distribution of Census Tract Heat Vulnerability Index (HVI) Scores for Home Owners Loan Corporation (HOLC) Grades. “HOLC Grade” x‐axis label represents HOLC lending risk grade. Grade D represents historically “redlined” census tracts. Differences in HVI scores between adjacent HOLC grades were statistically significant (p‐value < 0.001) according to post‐hoc honest significant difference tests. Boxes depict HVI score interquartile range for each HOLC grade stratum. The middle line within the box marks the median HVI score for each HOLC grade. N = 10,701 census tracts with both a HOLC grade and complete data to calculate an HVI score.
