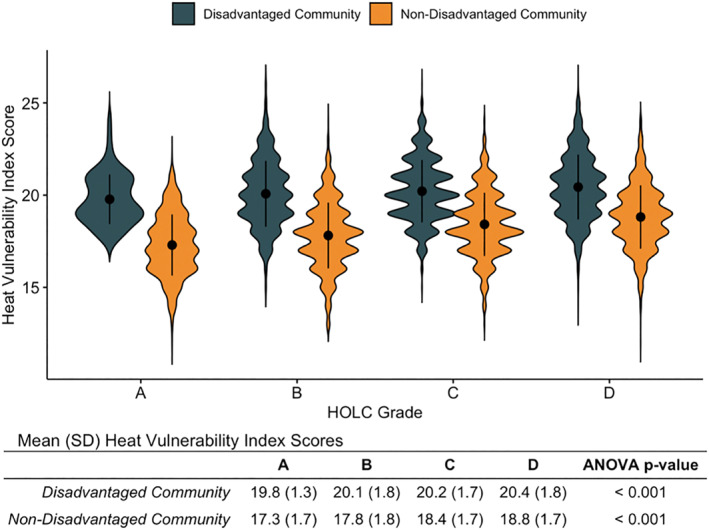
Figure 3.

Heat Vulnerability Index (HVI) Scores for Disadvantaged Communities and Home Owners Loan Corporation (HOLC) Grades. Violin plots show the density of census tracts receiving a particular HVI score given their HOLC grade and disadvantaged community status. Wider portions of the violin indicate more census tracts with the corresponding HVI score, while narrower portions indicate fewer census tracts with corresponding HVI score. The black dot and error bar within each violin mark the mean HVI score and standard deviation for each HOLC grade and disadvantaged community status stratum. N = 10,701 census tracts with both a HOLC grade and complete data to calculate an HVI score.
