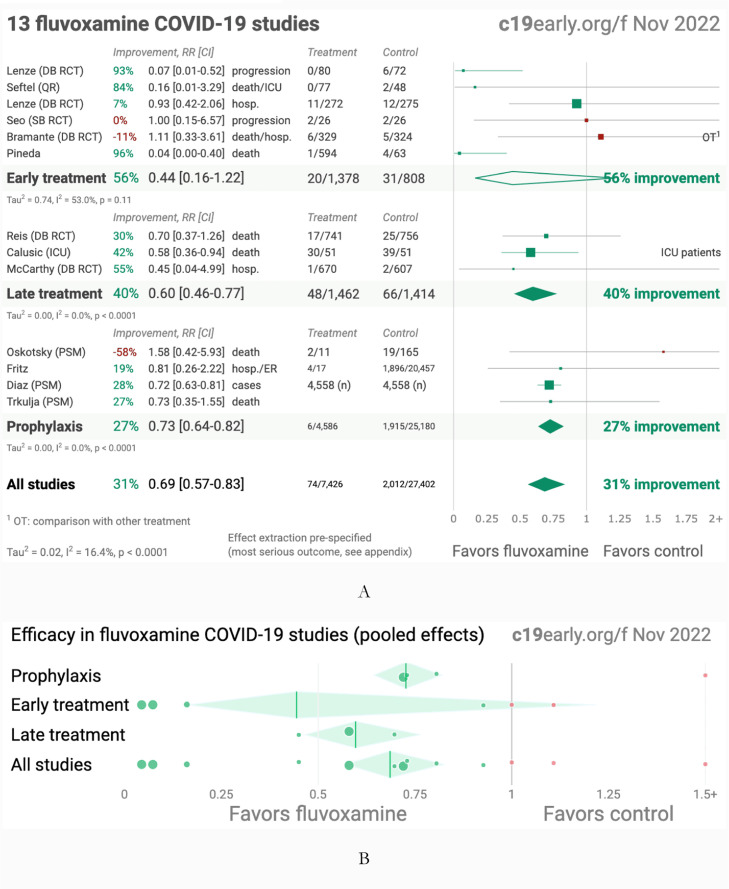
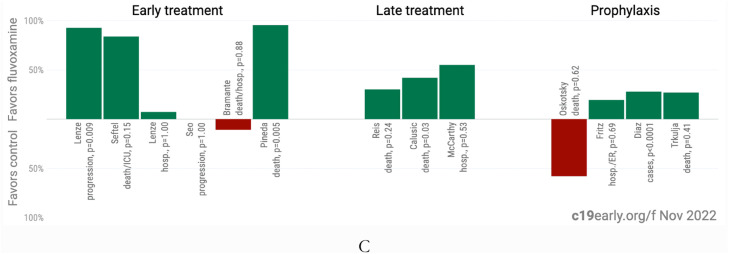
Fig. 1.
A. Random effects meta-analysis. B. Scatter plot showing the most serious outcome in all studies, along with the result of random effects meta-analysis. C. History of all reported effects (chronological within treatment stages). Images from (c19early.org/ 2022). Credit c19early.org. Supporting works are Reis doi.org/10.1016/S2214-109X(21)00,448-4, Lenze doi.org/10.1001/jama.2020.22760, Seftel doi.org/10.1093/ofid/ofab050, Lenze dcricollab.dcri.duke.edu/sites/NIHKR/KR/GR-Slides-08–20–21.pdf, Seo doi.org/10.3947/ic.2021.0142, Bramante doi.org/10.1056/NEJMoa2201662, Pineda doi.org/10.1101/2022.09.27.22280428, Calusic doi.org/10.1111/bcp.15126, McCarthy doi.org/10.1101/2022.10.17.22281178, Oskotsky doi.org/10.1001/jamanetworkopen.2021.33090, Fritz doi.org/10.1038/s41398-022-02,109-3, Diaz doi.org/10.4088/PCC.22br03337 and Trkulja doi.org/10.21203/rs.3.rs-2,239,187/v1.


