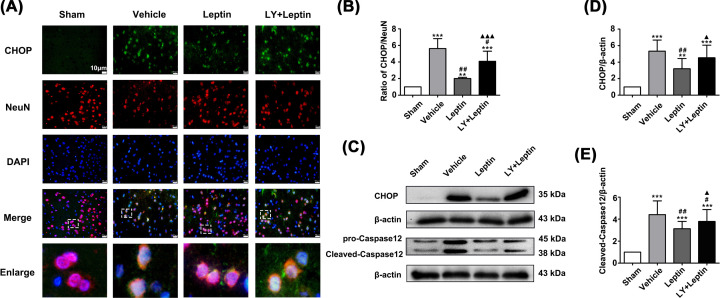
Figure 8. Leptin decreased the expression of CHOP and Caspase12.
(A,B) Costained for CHOP (green), NeuN(red) and DAPI (blue) (scale bar: 10 μm) and semiquantitative analysis of CHOP expression in the ischemic cortex. (C-E) Representative western blot images and quantitation of CHOP and Caspase12. The quantitative results are presented as the mean±SEM (n = 3 per group). **P<0.01, versus the control group; ***P<0.001, versus the control group; #P<0.05, versus the vehicle group; ##P<0.01, versus the vehicle group; ▲P<0.05, versus the leptin group; ▲▲▲P<0.001, versus the leptin group.

