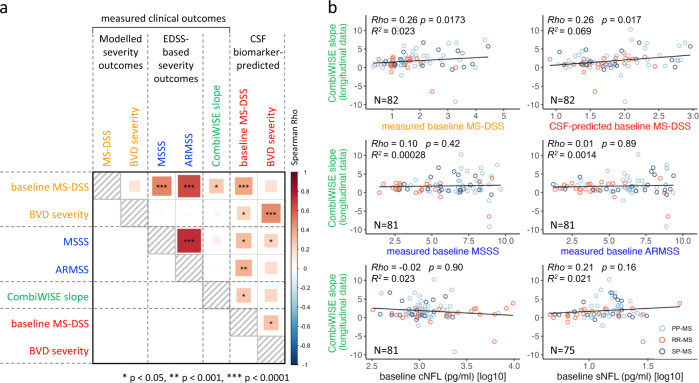
Fig. 7. MS severity outcomes in the validation cohort and their associations with cerebrospinal fluid (CSF) model predictions.
a Spearman correlation (the size and color of the square represent the Spearman Rho; significance levels are depicted by stars) between five measured clinical outcomes and two CSF biomarker-predicted multiple sclerosis (MS) severity outcomes in the validation cohort (N = 98). b Correlations between prospectively measured MS progression slopes (i.e., therapy adjusted CombiWISE slopes derived from longitudinal clinical follow-up; y-axes), clinical/imaging outcomes and CSF biomarker-predicted outcomes (x-axes). For exact Spearman Rho, p-values, and R2 see Supplementary Data 8. MS-DSS Multiple Sclerosis Disability Severity Score, MSSS Multiple Sclerosis Severity Score, ARMSS Age-Related Multiple Sclerosis Severity, CombiWISE Combinatorial weight-adjusted disability score, sNFL serum neurofilament light chain, cNFL CSF neurofilament light chain. All statistical tests were two-sided. Source data are provided as a Source Data file.

