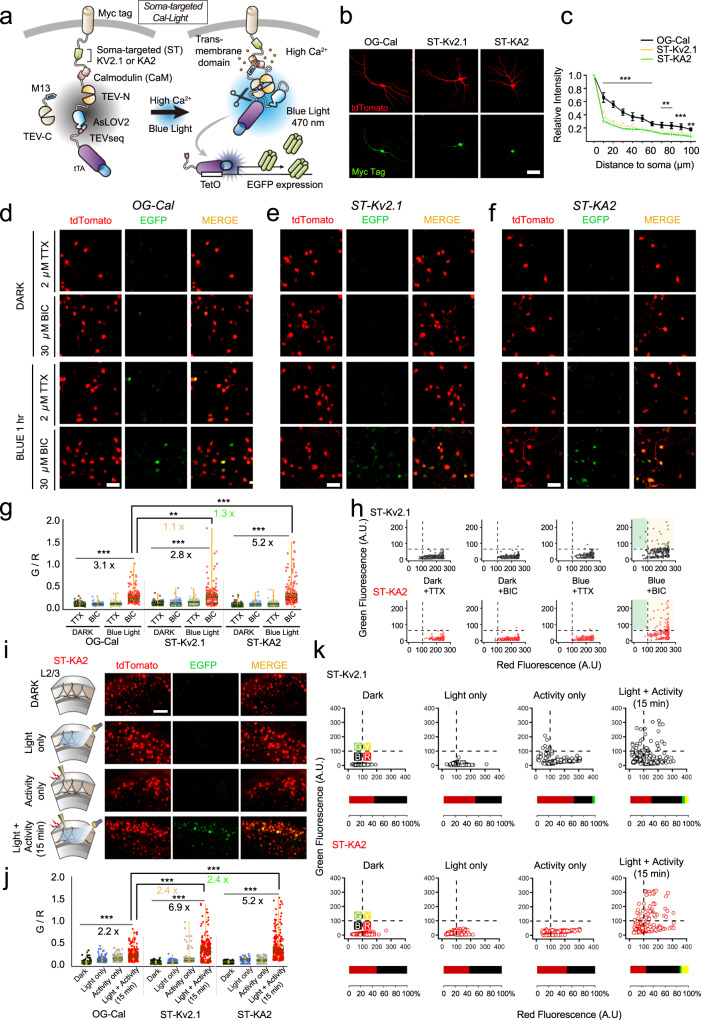
Fig. 1. Development and verification of soma-targeted Cal-Light.
a Graphical illustration of soma-targeted Cal-Light system. Elevation of Ca2+ concentration in the cytosol causes M13 and CaM protein interaction which causes binding of c- and n-terminus of tobacco etch virus (TEV) protease (TEV-C and TEV-N). When TEV-C and -N fragment bind, they regain proteolytic functions; however, the TEV recognition sequence (TEVseq) is buried inside of AsLOV2 Jα-helix, so TEV protease access to the TEVseq is prohibited. Blue light triggers structural changes of AsLOV2, rendering the TEVseq exposed to the cytosol. Then, TEV protease cleaves out tTA, and gene expression begins. b Confocal images of the cell transfection marker, tdTomato (red), and antibody staining of myc epitope (green). The scale bar indicates 50 μm. c The degree of expression in soma and dendrites. The green-to-red signal (G/R) ratio was normalized to the cell body, and the ratio was measured from the cell body up to 100 μm in dendrites. d–f Representative images of EGFP reporter gene expression in various conditions. Original Cal-Light (d), ST-KV2.1 (e), and ST-KA2 constructs (f) were transfected in hippocampal culture neurons, and neural activity was controlled by 2 μM TTX or 30 μM bicuculline (Bic). The scale bar indicates 50 μm. g Comparison of gene expression. G/R ratios from individual cells are plotted. An intermittent flash of blue light (1 s ON/9 s OFF) was illuminated for 1 h G/R and was analyzed with one-way ANOVA. Asterisks (**p < 0.01 and ***p < 0.001) indicate Bonferroni post hoc significance. h Scatter plot of G/R. Open circles indicate individual neurons. Yellow-colored area indicates neuronal population with both green and red signals. The green area indicates cells with a green fluorescence alone. i Schematic of experimental conditions. Representative images from each condition (dark, light only, activity only, light + activity) are shown. tdTomato is a transfection marker, and EGFP is a reporter. Scale bars, 80 μm. j Summary graph of the G/R ratio from cells transfected with OG-Cal, ST-Kv2.1, and ST-KA2, respectively. G/R values from individual neurons and a summary box plot chart are superimposed. The magnitude was robustly enhanced when both light and activity were present. k Green and red fluorescence values from individual neurons were plotted. Individual neurons were divided into four groups (green, yellow, red, and black) by the level of red and green fluorescence. The horizontal bar graph represents the percentage of red, black, green, and yellow groups. For all graphs, *,**, and *** indicate p < 0.05, p < 0.001, and p < 0.005, respectively. Box plots show the median, 25th and 75th percentiles, and whiskers show min to max. Error bars indicate s.e.m. Source data and statistics are provided in the Source Data file.

