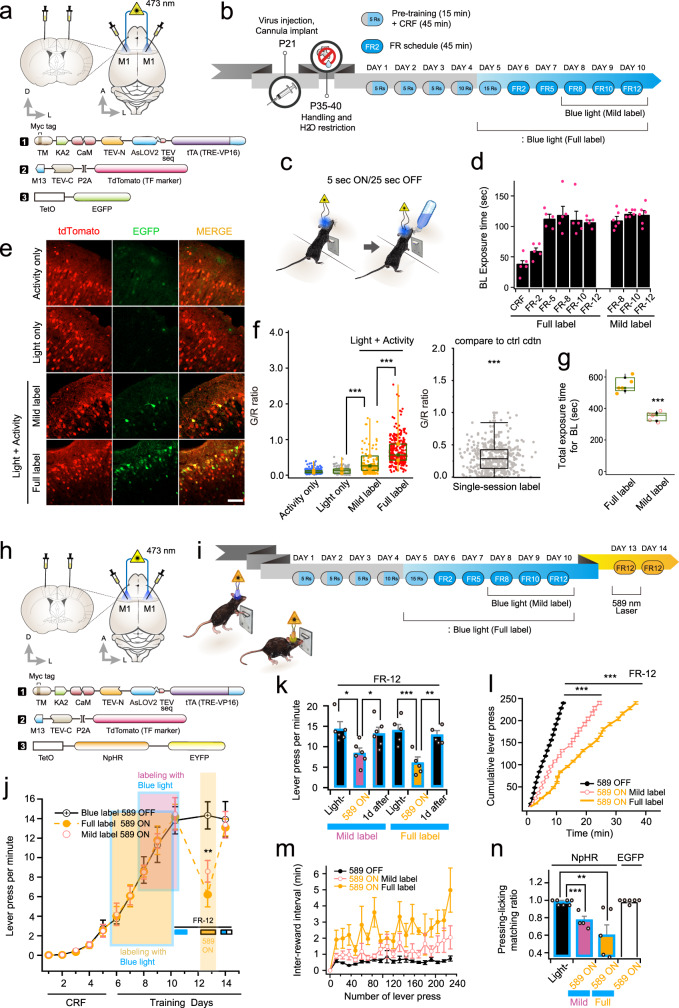
Fig. 2. Labeling and control of active neurons engaged with lever-pressing behavior.
a ST-KA2 viruses with AAV-TetO-EGFP were bilaterally injected into layer 2/3 of the primary motor cortex. b Schematic mouse training schedule and labeling procedures with blue light. 5Rs, 10Rs, and 15Rs indicate that mice receive five (5Rs), ten (10Rs), and fifteen rewards (15Rs), respectively. c Fiber optics for blue light illumination were implanted in both sides of the primary motor cortex. d Blue light exposure time per training day was measured. tdTomato signal indicates the efficiency of viral injection. Higher green fluorescence was observed as blue light exposure time increases. Scale bars, 100 μm. e When cell labeling is finished, the brain was fixed, and the degree of gene expression was quantified by confocal imaging. f Individual G/R ratios with the box plot chart superimposed. g, A box plot chart for total blue light exposure time at each condition. h Schematic drawing of virus injection and fiber optic implantation (top) and injected three viral constructs (bottom). i Mouse training, labeling by blue light, and halorhodopsin inhibition procedures. Active neurons during lever pressing were labeled by blue light, and their activity was inhibited by 589 light. j Total number of lever presses increased over training days. Periods of blue light labeling were indicated by shaded boxes with different colors (five mice for full labeling, and six mice for mild labeling). The number of lever presses was significantly reduced by a 589 nm laser but fully recovered the following day in the absence of 589 nm light (inset: blue horizontal bar underneath the FR-12 label indicates the last day of training with labeling in the presence of blue light. The yellow horizontal bar indicates the probe-test day in the presence of yellow light throughout the session (2 s ON, 1 s OFF). The bar half-filled with blue indicates the following day in the absence of yellow light but labeled with blue light during training). k, The total lever pressing number was compared before and after 589 nm light, and the following day of the inhibition test. l The number of lever presses was plotted over time to demonstrate how fast animals reach the goal. Note that more time was required to reach 250 lever presses when the 589 nm light is turned on after labeling. m Inter-reward interval was prolonged when the yellow light was turned on. n Summary graph of lever pressing-licking matching ratio. For all graphs, *,**, and *** indicate p < 0.05, p < 0.001, and p < 0.005, respectively. Box-and-whisker plot shows the median, 25th and 75th percentiles, and whiskers show min to max. Error bars indicate s.e.m. Source data and statistics are provided in the Source Data file.

